When I go to my server home page, the images load, but they take a while to load, it’ll stick on grey posters for a good 10seconds before they appear. An example of this is below.
Also, when going into each Library, the “recommended” page takes significantly longer to load than “library”, “collections” or “categories” so I think its linked with the above.
I am using UNRAID, and my Plex Metadata folder is on its own SSD with nothing else occupying that drive, my Metadata folder stands at about 130GB in size. I have a fairly large Library but not horrendously large.
Is there anything I can do to speed this up a bit?
I am running UNRAID on a system that has 2x Intel® Xeon® CPU E5-2690 v2 @ 3.00GHz with 96GB of DDR3 RAM.
Is there an easy way I can check how many indexed items I have?
I do have a lot of other containers running, such as the *Arrs, Overseerr, Tautulli, Immich, Adguard
Is it worth having Plex container using pinned CPU’s so those cores aren’t being used by anything else other than Plex or is this pointless? If it is beneficial how many CPU cores would you recommend for Plex, and would you split the cores across two CPU’s?
Music - 76510 tracks over 5,000 Albums.
TV Shows - 2,300
TV Shows - Reality 3,100
TV Shows - Kids 720
Movies - Kids 900
Movies - Misc/Home Videos 3,000
Movies - 5,000
I’m wondering, could it possibly be the Music Library bogging down the server, and maybe putting the Music on its own Plex instance could help?
Here is my Database directory, there are some large filesizes here, for the BLOBS.db-WAL and the BLOBS.db, is this normal for them to be this size?
I have optimized both through Plex (also cleaned bundles), and also with your tool just yesterday. I have also ran Image Maid to remove any unused metadata posters, that deleted over 15,000 images, saving around 4GB of space.
When you say still pending, is it normal for that filesizes in the WAL to be pending, because I would think it should only be quite small if its passing the stuff to the db as it happens, so I’m confused to why are they still Pending?
What’s the best way forward for me right now, as from your replies I get the feeling that those WAL & SHM sizes are probably not normal?
The WAL (Write Ahead Lookup) is a cache file of the pending database commits.
The SHM (Shared Memory) is a buffer and should only be present when PMS is running. If it’s residual, then there was a crash/abrupt shutdown and the data didn’t get included.
When they do exist, they force , especially at these sizes, SQLite must look at all those records too — EVEN IF they conrtadict/supersede what’s in the DB.
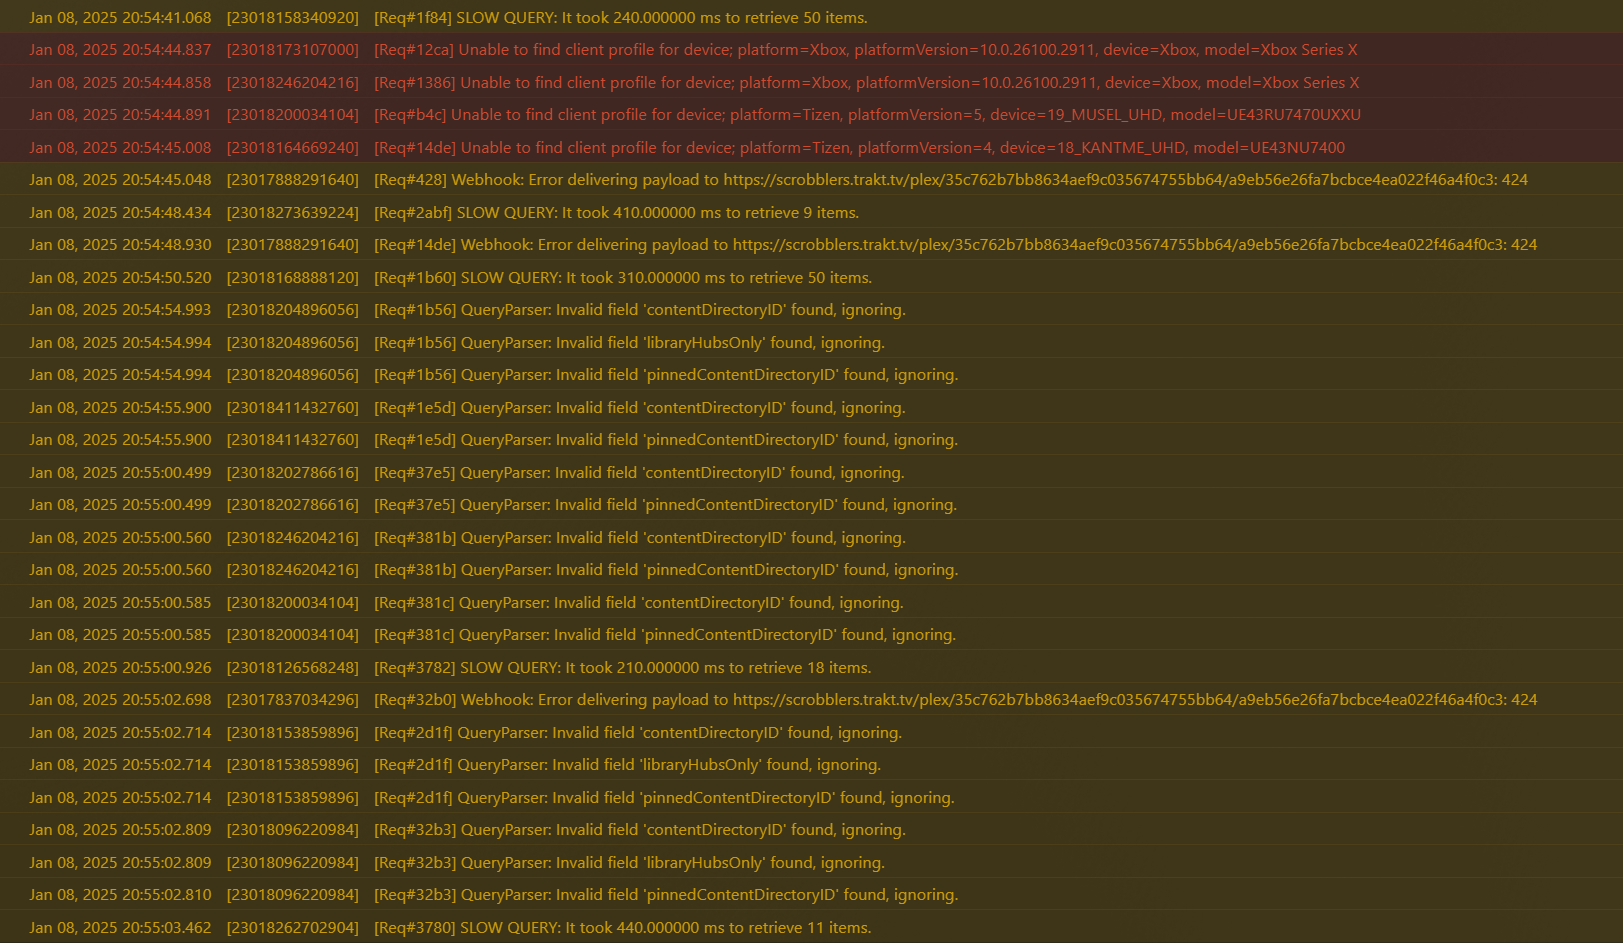
I am still getting Recommended tabs loading really slowly. Sometimes minutes. Most times a forced refresh of the page is needed. This happens on every single device.
I would consider 5 minutes to show the “Recommended” page on a Library very slow, I’ve never known it take such a long time, sometimes it just spins forever, until its refreshed, then it would load instantly.