Plex randomly losses access to network media for ~15 minutes

Server Version#: 4.149.0
Player Version#: Sony Bravo TV App
Lifetime Plex Pass

Setup

ProxMox Hypervisor
Ubuntu Server 22.0.4LTS
i7 11th gen iGPU
10Gbps Network
12 cores/16GB RAM/200GB Storage with about 30GB free
Synology NAS Running latest code
SMB mapped network drive on Plex Server to Synology Media store

This just started within the last 1-2 months, setup has been working fine for years without this issue. Randomly while watching a show locally or remotely, plex will suddenly stop playing with a message “Your connection to the server is not fast enough to play the media” and it will just buffer and not resume play. If I back out of the media, my plex server is still up and still lists all the media I have on it, however I am unable to play any content. When I try to play different shows or movies, it just shows the buffering icon and never plays. When this happens, if I log into the Plex server and go to my mounted folder and try to list the contents, it will just hang. Using different devices like Phone, PC to watch plex does not work and neither does remote streaming. When this does happen, the SMB file share for the media works fine from my desktop PC and there are no other issues access or utilizing the NAS. This seems to happen regardless of transcoding and happens to all media and what appears to be random. After about 15 minutes, everything works fine again until it happens again. Which could be in 15 minutes or 4 hours.

Others I have spoken to who have the same issue have reported the following

NFS or SMB doesnt make a difference
Network hardware does not appear to be a problem

Happens on Windows or Linux
I am an experienced network engineer and my home network is more robust and well built that most data centers.

Further investigating, I did swap to using NFS and this had no impact on the issue at all. I am sure its not a network issue at this time and also I am sure its not an OS issue as well.

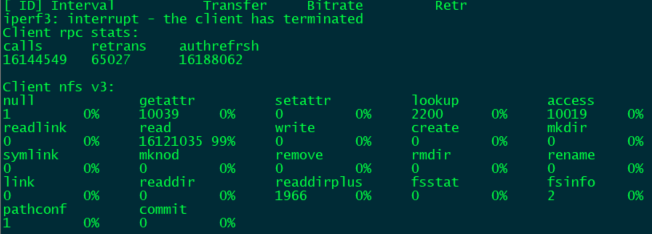
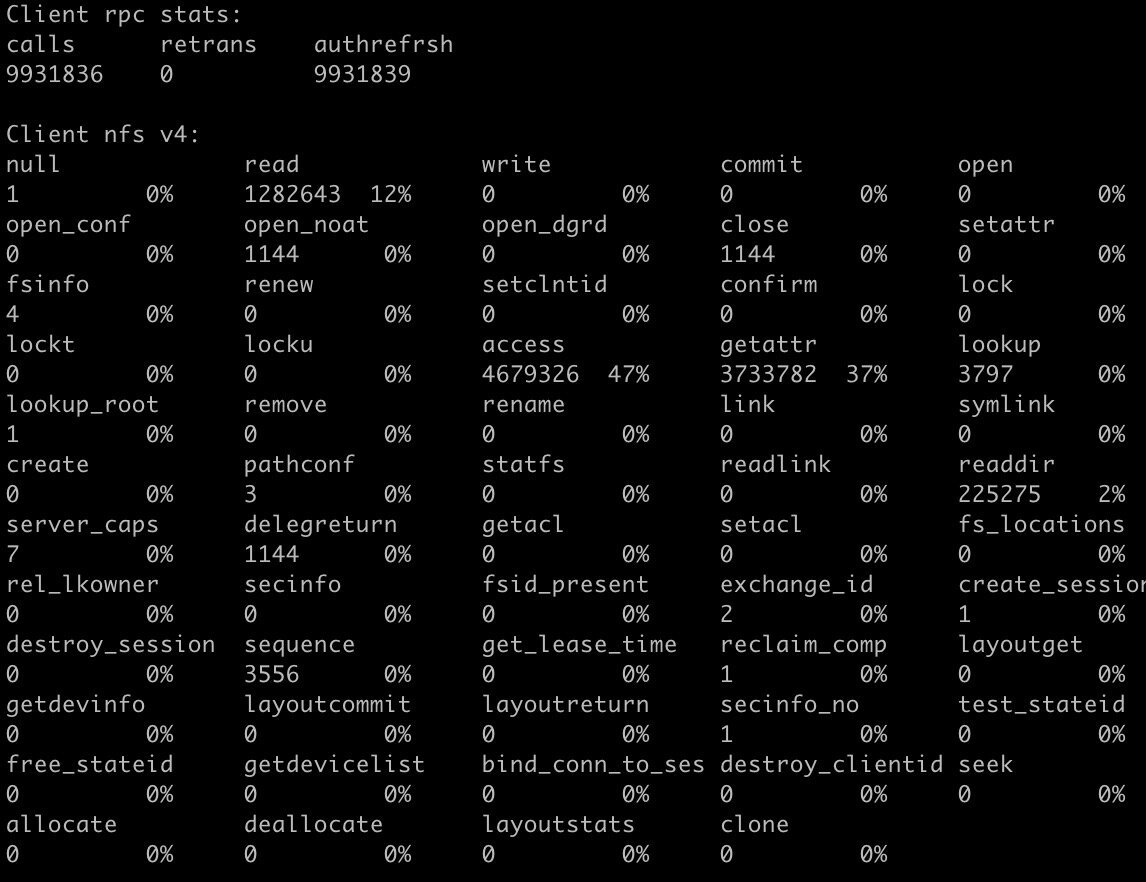
One thing I did find is that there is a significantly high number of NFS retrans on the Plex server to the NAS. I believe there is an automated plex scan running that is hammering the NFS queries and causing the issue. These numbers were only 24 hours after swapping from SMB to NFS for the mount.

If you’re getting a lot of re-transmits then there is a network issue and that will drive the NFS counts sky high

Here is my network after 12 days with 4 active servers (1 main, 3 in containers)

[chuck@lizum ~.2003]$ uptime
 12:02:00 up 12 days, 15:45,  1 user,  load average: 0.10, 0.19, 0.31
[chuck@lizum ~.2004]$ nfsstat
Client rpc stats:
calls      retrans    authrefrsh
2968644    0          2970943 

Client nfs v4:
null             read             write            commit           open             
19        0%     1184347  39%     900709   30%     47450     1%     6603      0%     
open_conf        open_noat        open_dgrd        close            setattr          
0         0%     45063     1%     1         0%     49811     1%     4071      0%     
fsinfo           renew            setclntid        confirm          lock             
57        0%     0         0%     0         0%     0         0%     0         0%     
lockt            locku            access           getattr          lookup           
0         0%     0         0%     68614     2%     558059   18%     19420     0%     
lookup_root      remove           rename           link             symlink          
19        0%     1652      0%     1395      0%     39        0%     0         0%     
create           pathconf         statfs           readlink         readdir          
101       0%     38        0%     795       0%     12        0%     22215     0%     
server_caps      delegreturn      getacl           setacl           fs_locations     
95        0%     45971     1%     0         0%     0         0%     0         0%     
rel_lkowner      secinfo          fsid_present     exchange_id      create_session   
0         0%     0         0%     0         0%     3         0%     3         0%     
destroy_session  sequence         get_lease_time   reclaim_comp     layoutget        
1         0%     12656     0%     1         0%     2         0%     0         0%     
getdevinfo       layoutcommit     layoutreturn     secinfo_no       test_stateid     
0         0%     0         0%     0         0%     0         0%     0         0%     
free_stateid     getdevicelist    bind_conn_to_ses destroy_clientid seek             
0         0%     0         0%     0         0%     0         0%     241       0%     
allocate         deallocate       layoutstats      clone            
0         0%     0         0%     0         0%     0         0%     

[chuck@lizum ~.2005]$

How’s the network setup for the server? Wired or WiFi ?

Hey @ChuckPa, not sure if you remember me. I had a similar issue as Jay and made a post here about it. Jay and I have been chatting over on Reddit, where it seems others have encountered similar behavior albeit with different setups.

The one thing Jay and I had in common was our NAS was plugged into a UniFi Aggregation switch. Since I moved mine over to a new UniFi 10-Gb switch and took the Aggregation switch out of the network path, I have not encountered the issue anymore. All in all, very odd behavior. I might move my NAS back over to the Aggregation switch to see how my nfsstat’s compare between now and then.

Network setup is 10Gbps to the Synology NAS using Intel X520 with DAC to an Ubiquiti 10Gbps Aggregate Layer 2 Switch. This has a 10Gbps DAC to a core UDM Pro, from there the plex is on a different network with the L3 being on the UDM Pro and connects via 1Gbps RJ45 to a Ubiquiti Access switch. Plex itself is hosted on a Proxmox VM running Ubuntu 22.0.4 LTS. I did have Jumbo frames enabled on my network gear, but not on my NAS or Plex server, I just disabled Jumbo frames today on all network gear. This setup had been in place and working fine for about 2 years prior to this issue starting up. And one thing to note is that when this happens its only a problem between Plex and the NAS. If SMB/NFS starts failing, from another device like my PC to the same content works fine.

What are you using in the Syno for 10GbE nic?

Turn off ALL the jumbo frames. Jumbo frames are either ALL ON or ALL OFF.

With NFS, you want them OFF

The Synology uses the Intel X520 NIC with DAC to the Ubiquiti 10G Agg Switch.

THat’s not on their documented compatibility list from what I can see unless you mean these ? (More detail please?)

Intel	Ethernet Converged Network Adapter X520-SR2	E10G42BFSR	-	2 x 10GbE	LC Connector	PCIe 2.0 x8	View 
Intel	Ethernet Converged Network Adapter X520-T2	E10G42BT

Yeah its not on the official list, but the drivers install automatically just fine. Its the Intel X520-T1, single port instead of the dual port X520-T2. I also reconfigured my NAS to use the onboard RJ45 interfaces at 1Gbps and the issue persisted.

(synogear) root@nas-1:~# cat /sys/class/net/eth4/device/vendor
0x8086
(synogear) root@nas-1:~# lspci -nn | grep -i 10fb
01:00.0 Class [0200]: Device [8086:10fb] (rev 01)
root@nas-1:~# dmesg | grep -i network
[ 48.054476] Intel(R) 10GbE PCI Express Linux Network Driver - version 5.5.5
[ 48.236740] ixgbe 0000:01:00.0 eth0: Intel(R) 10 Gigabit Network Connection
[ 48.251799] i40e: Intel(R) 40-10 Gigabit Ethernet Connection Network Driver - version 2.7.29

(synogear) root@nas-1:~# ethtool eth4
Settings for eth4:
Supported ports: [ FIBRE ]
Supported link modes: 10000baseT/Full
Supported pause frame use: Symmetric
Supports auto-negotiation: No
Supported FEC modes: Not reported
Advertised link modes: 10000baseT/Full
Advertised pause frame use: Symmetric
Advertised auto-negotiation: No
Advertised FEC modes: Not reported
Speed: 10000Mb/s
Duplex: Full
Port: Direct Attach Copper
PHYAD: 0
Transceiver: external
Auto-negotiation: off
Supports Wake-on: d
Wake-on: d
Current message level: 0x00000007 (7)
drv probe link
Link detected: yes

(synogear) root@nas-1:~# ethtool -i eth4
driver: ixgbe
version: 5.5.5
firmware-version: 0x2b2c0001
expansion-rom-version:
bus-info: 0000:01:00.0
supports-statistics: yes
supports-test: yes
supports-eeprom-access: yes
supports-register-dump: yes
supports-priv-flags: yes

(synogear) root@nas-1:~# ethtool -S eth4
NIC statistics:
rx_packets: 186884955
tx_packets: 161750743
rx_bytes: 230649259068
tx_bytes: 233487279700
rx_errors: 0
tx_errors: 0
rx_dropped: 0
tx_dropped: 0
multicast: 545632
collisions: 0
rx_over_errors: 0
rx_crc_errors: 0
rx_frame_errors: 0
rx_fifo_errors: 0
rx_missed_errors: 0
tx_aborted_errors: 0
tx_carrier_errors: 0
tx_fifo_errors: 0
tx_heartbeat_errors: 0
rx_pkts_nic: 186885570
tx_pkts_nic: 161751322
rx_bytes_nic: 231398991531
tx_bytes_nic: 234143775269
lsc_int: 4
tx_busy: 0
non_eop_descs: 0
broadcast: 294026
rx_no_buffer_count: 0
tx_timeout_count: 0
tx_restart_queue: 0
rx_length_errors: 0
rx_long_length_errors: 0
rx_short_length_errors: 0
tx_flow_control_xon: 0
rx_flow_control_xon: 0
tx_flow_control_xoff: 0
rx_flow_control_xoff: 0
rx_csum_offload_errors: 0
alloc_rx_page: 2304654
alloc_rx_page_failed: 0
alloc_rx_buff_failed: 0
rx_no_dma_resources: 0
hw_rsc_aggregated: 0
hw_rsc_flushed: 0
fdir_match: 243
fdir_miss: 337
fdir_overflow: 0
os2bmc_rx_by_bmc: 0
os2bmc_tx_by_bmc: 0
os2bmc_tx_by_host: 0
os2bmc_rx_by_host: 0
tx_hwtstamp_timeouts: 0
tx_hwtstamp_skipped: 0
rx_hwtstamp_cleared: 0
tx_queue_0_packets: 161750743
tx_queue_0_bytes: 233487279700
rx_queue_0_packets: 186884955
rx_queue_0_bytes: 230649259068

One of the things im considering for a next step is that I have extra ports available on my ProxMox server and my NAS, i may try directly cabling them together over 1Gbps RJ45.

with the Syno as 1/2 the equation, have you done an iperf3 stress test on the network layer? This confirms L2 & L3 are solid. I would rub it for however long it takes to trigger the failure.

You should get some retrans in one direction but the -R direction should have none.

iperf3 for Syno is here

SynoCli Monitor Tools v1.7-10

e.g.

[  5]  25.00-26.00  sec   112 MBytes   935 Mbits/sec    0    851 KBytes       
[  5]  25.00-26.00  sec   112 MBytes   935 Mbits/sec    0    851 KBytes       
- - - - - - - - - - - - - - - - - - - - - - - - -
[ ID] Interval           Transfer     Bitrate         Retr
[  5]   0.00-26.00  sec  2.89 GBytes   954 Mbits/sec    0            sender
iperf3: the client has terminated
-----------------------------------------------------------
Server listening on 5201 (test #3)
---------------------------------------

jayecin@plex-2:~$ iperf3 -c 10.10.8.40 -t 30
Connecting to host 10.10.8.40, port 5201
[ 5] local 10.10.9.50 port 57330 connected to 10.10.8.40 port 5201
[ ID] Interval Transfer Bitrate Retr Cwnd
[ 5] 0.00-1.00 sec 114 MBytes 953 Mbits/sec 0 3.15 MBytes
[ 5] 1.00-2.00 sec 111 MBytes 933 Mbits/sec 0 3.15 MBytes
[ 5] 2.00-3.00 sec 111 MBytes 933 Mbits/sec 0 3.15 MBytes
[ 5] 3.00-4.00 sec 110 MBytes 923 Mbits/sec 0 3.15 MBytes
[ 5] 4.00-5.00 sec 111 MBytes 933 Mbits/sec 0 3.15 MBytes
[ 5] 5.00-6.00 sec 110 MBytes 923 Mbits/sec 0 3.15 MBytes
[ 5] 6.00-7.00 sec 111 MBytes 933 Mbits/sec 0 3.15 MBytes
[ 5] 7.00-8.00 sec 111 MBytes 933 Mbits/sec 0 3.15 MBytes
[ 5] 8.00-9.00 sec 110 MBytes 923 Mbits/sec 0 3.15 MBytes
[ 5] 9.00-10.00 sec 111 MBytes 933 Mbits/sec 0 3.15 MBytes
[ 5] 10.00-11.00 sec 111 MBytes 933 Mbits/sec 0 3.15 MBytes
[ 5] 11.00-12.00 sec 110 MBytes 923 Mbits/sec 0 3.15 MBytes
[ 5] 12.00-13.00 sec 110 MBytes 923 Mbits/sec 0 3.15 MBytes
[ 5] 13.00-14.00 sec 111 MBytes 933 Mbits/sec 0 3.15 MBytes
[ 5] 14.00-15.00 sec 111 MBytes 933 Mbits/sec 0 3.15 MBytes
[ 5] 15.00-16.00 sec 111 MBytes 933 Mbits/sec 0 3.15 MBytes
[ 5] 16.00-17.00 sec 110 MBytes 923 Mbits/sec 0 3.15 MBytes
[ 5] 17.00-18.00 sec 111 MBytes 933 Mbits/sec 0 3.15 MBytes
[ 5] 18.00-19.00 sec 110 MBytes 923 Mbits/sec 0 3.15 MBytes
[ 5] 19.00-20.00 sec 111 MBytes 933 Mbits/sec 0 3.15 MBytes
[ 5] 20.00-21.00 sec 111 MBytes 933 Mbits/sec 0 3.15 MBytes
[ 5] 21.00-22.00 sec 110 MBytes 923 Mbits/sec 0 3.15 MBytes
[ 5] 22.00-23.00 sec 111 MBytes 933 Mbits/sec 0 3.15 MBytes
[ 5] 23.00-24.00 sec 110 MBytes 923 Mbits/sec 0 3.15 MBytes
[ 5] 24.00-25.00 sec 111 MBytes 933 Mbits/sec 0 3.15 MBytes
[ 5] 25.00-26.00 sec 111 MBytes 933 Mbits/sec 0 3.15 MBytes
[ 5] 26.00-27.00 sec 110 MBytes 923 Mbits/sec 0 3.15 MBytes
[ 5] 27.00-28.00 sec 111 MBytes 933 Mbits/sec 0 3.15 MBytes
[ 5] 28.00-29.00 sec 111 MBytes 933 Mbits/sec 0 3.15 MBytes
[ 5] 29.00-30.00 sec 110 MBytes 923 Mbits/sec 0 3.15 MBytes


[ ID] Interval Transfer Bitrate Retr
[ 5] 0.00-30.00 sec 3.25 GBytes 930 Mbits/sec 0 sender
[ 5] 0.00-30.00 sec 3.25 GBytes 929 Mbits/sec receiver

iperf Done.

I ran -t 200 and then -t 200 -R to hammer both directions at max speed.

From Plex with 1Gbps RJ45

iperf3 -c 10.10.8.40 -t 180 -R

[ ID] Interval Transfer Bitrate Retr
[ 5] 0.00-180.00 sec 19.6 GBytes 935 Mbits/sec 1439 sender
[ 5] 0.00-180.00 sec 19.6 GBytes 935 Mbits/sec receiver

iperf3 -c 10.10.8.40 -t 180

[ ID] Interval Transfer Bitrate Retr
[ 5] 0.00-180.00 sec 19.5 GBytes 929 Mbits/sec 0 sender
[ 5] 0.00-180.00 sec 19.5 GBytes 929 Mbits/sec receiver

From my Windows 11 Desktop PC at 5Gbps RJ45, identical network hardware path besides different subnet from Plex.

iperf3.exe -c 10.10.8.40 -t 180 -R

[ ID] Interval Transfer Bandwidth Retr
[ 4] 0.00-180.00 sec 30.0 GBytes 1.43 Gbits/sec 21 sender
[ 4] 0.00-180.00 sec 30.0 GBytes 1.43 Gbits/sec receiver

how frequently does it drop out? (Interval between failures)

With Plex? Its random however it seems to happen more during the evening or when new content is added. Sometimes it will be fine for 4-5 hours, yesterday for example it was every 5 minutes, however I was trying to watch a show that I had just added. Its not file specific because some times media will play horribly, then the next time it plays just fine. It happens with 1080p or 4k being played on a 4K TV.

Thanks for the logs (Yes, I got them)

  1. You turned off DEBUG which prevented me from seeing the majority of what I need

  2. The errors I do see are inotify event queue overflow errors

Received unexpected inotify event: 1073750016

From the Wiki:

The error “Received unexpected inotify event: 1073750016” indicates that an application using the Linux inotify system received an unknown or unhandled event code. The specific value, 1073750016, is a bitmask that combines two important events: IN_Q_OVERFLOW and IN_ISDIR.

Decoding the inotify event code

  • IN_Q_OVERFLOW (0x00004000 or 16384): This event indicates that the event queue for the inotify instance has overflowed and some events were lost. This happens when file system changes occur faster than the monitoring application can process them.
  • IN_ISDIR (0x40000000 or 1073741824): This is not a standalone event but a flag that’s often combined with other events to indicate that the event occurred on a directory.

The decimal value 1073750016 is the result of adding the two hexadecimal values together:
0x40000000 + 0x00004000 = 0x40004000
In decimal, this is 1073741824 + 16384 = 1073750016.

The message therefore means an event queue overflow occurred while monitoring a directory.

Do you have a script / task which sets permissions on all your media recursively ?

Ha nice, glad you got them.

The only thing this server does besides Plex is Tautuli, other than that it was just setup with basic user/group permissions to get Plex and the mounts working. No other scripts that I would have setup or ran for any purposes, very vanilla Ubuntu Server install. I can turn on debug/verbos logging if needed and try to capture better information.

Wow,

That’s worse.

How many VCPUs and much memory does the VM have ?

How much media (total files) are you indexing into PMS ? (rough count in thousands is good enough)