Slow Queries

Server Version#: 1.13.6.5339
Player Version#: ATV/etc.

I have a Debian 9 server running my plex media server. I have everything installed on SSD with very little running on it. I notice quite a bit get WARN Slow queries on retrieving items and I can see slowness when refreshing things and general screen moving. I have a decent size library:

21744 files in library
0 files missing analyzation info
0 media_parts marked as deleted
0 metadata_items marked as deleted
0 directories marked as deleted
21696 files missing deep analyzation info.

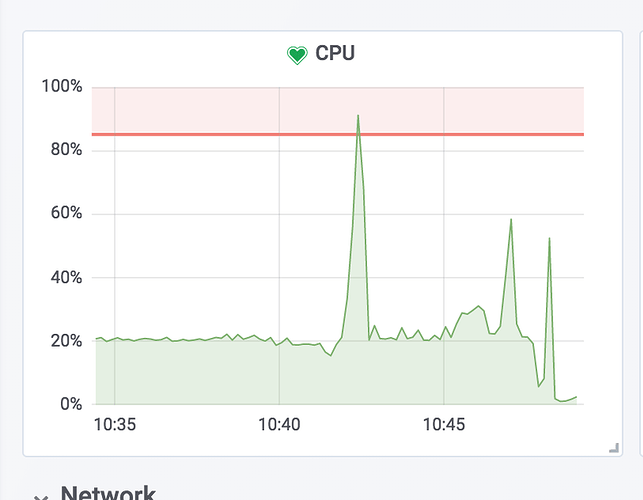
I run netdata/grafana so I can see no CPU bottlenecks nor any IO bottlenecks as the system is just about idle when things are going on. As an example, I’m running an Optimize now for some 4k stuff to 1080p and I’m seeing these:

Aug 29, 2018 10:01:43.025 [0x7fe7b0bfe700] WARN - SLOW QUERY: It took 460.000000 ms to retrieve 1 items.
Aug 29, 2018 10:01:43.037 [0x7fe7d47ff700] WARN - SLOW QUERY: It took 490.000000 ms to retrieve 50 items.
Aug 29, 2018 10:01:44.678 [0x7fe7d77fa700] WARN - SLOW QUERY: It took 230.000000 ms to retrieve 4 items.
Aug 29, 2018 10:01:44.683 [0x7fe7c67fe700] WARN - SLOW QUERY: It took 210.000000 ms to retrieve 1 items.
Aug 29, 2018 10:01:44.746 [0x7fe7d7ffb700] WARN - SLOW QUERY: It took 500.000000 ms to retrieve 50 items.
Aug 29, 2018 10:01:46.329 [0x7fe7d77fa700] WARN - SLOW QUERY: It took 220.000000 ms to retrieve 4 items.
Aug 29, 2018 10:01:46.344 [0x7fe7d47ff700] WARN - SLOW QUERY: It took 330.000000 ms to retrieve 4 items.
Aug 29, 2018 10:01:46.378 [0x7fe7d67f8700] WARN - SLOW QUERY: It took 430.000000 ms to retrieve 1 items.
Aug 29, 2018 10:01:46.385 [0x7fe7d97fe700] WARN - SLOW QUERY: It took 570.000000 ms to retrieve 50 items.
Aug 29, 2018 10:01:47.929 [0x7fe7dcfff700] WARN - SLOW QUERY: It took 1600.000000 ms to retrieve 1 items.
Aug 29, 2018 10:01:47.929 [0x7fe7c0bff700] WARN - SLOW QUERY: It took 1600.000000 ms to retrieve 1 items.
Aug 29, 2018 10:01:48.008 [0x7fe7d6ff9700] WARN - SLOW QUERY: It took 240.000000 ms to retrieve 4 items.
Aug 29, 2018 10:01:48.014 [0x7fe7d8ffd700] WARN - SLOW QUERY: It took 320.000000 ms to retrieve 4 items.
Aug 29, 2018 10:01:48.023 [0x7fe7d67f8700] WARN - SLOW QUERY: It took 280.000000 ms to retrieve 16 items.
Aug 29, 2018 10:01:48.040 [0x7fe7d5ff7700] WARN - SLOW QUERY: It took 400.000000 ms to retrieve 1 items.
Aug 29, 2018 10:01:48.064 [0x7fe7b0bfe700] WARN - SLOW QUERY: It took 570.000000 ms to retrieve 1 items.
Aug 29, 2018 10:01:48.077 [0x7fe7b8ffe700] WARN - SLOW QUERY: It took 570.000000 ms to retrieve 50 items.
Aug 29, 2018 10:01:49.752 [0x7fe7d47ff700] WARN - SLOW QUERY: It took 1650.000000 ms to retrieve 1 items.
Aug 29, 2018 10:01:49.877 [0x7fe7d5ff7700] WARN - SLOW QUERY: It took 330.000000 ms to retrieve 1 items.
Aug 29, 2018 10:01:49.879 [0x7fe7d97fe700] WARN - SLOW QUERY: It took 390.000000 ms to retrieve 4 items.
Aug 29, 2018 10:01:49.889 [0x7fe7c0bff700] WARN - SLOW QUERY: It took 390.000000 ms to retrieve 1 items.
Aug 29, 2018 10:01:49.903 [0x7fe7b8ffe700] WARN - SLOW QUERY: It took 520.000000 ms to retrieve 50 items.
Aug 29, 2018 10:01:51.792 [0x7fe7b8ffe700] WARN - SLOW QUERY: It took 290.000000 ms to retrieve 4 items.
Aug 29, 2018 10:01:51.794 [0x7fe7c67fe700] WARN - SLOW QUERY: It took 230.000000 ms to retrieve 1 items.
Aug 29, 2018 10:01:51.798 [0x7fe7d67f8700] WARN - SLOW QUERY: It took 260.000000 ms to retrieve 4 items.
Aug 29, 2018 10:01:51.805 [0x7fe7b53ff700] WARN - SLOW QUERY: It took 370.000000 ms to retrieve 4 items.
Aug 29, 2018 10:01:51.839 [0x7fe7b03fd700] WARN - SLOW QUERY: It took 400.000000 ms to retrieve 50 items.
Aug 29, 2018 10:01:53.655 [0x7fe7b97ff700] WARN - SLOW QUERY: It took 370.000000 ms to retrieve 50 items.
Aug 29, 2018 10:01:55.264 [0x7fe7bfbfd700] WARN - SLOW QUERY: It took 1630.000000 ms to retrieve 2 items.
Aug 29, 2018 10:01:55.350 [0x7fe7bfbfd700] WARN - SLOW QUERY: It took 260.000000 ms to retrieve 4 items.
Aug 29, 2018 10:01:55.362 [0x7fe7c67fe700] WARN - SLOW QUERY: It took 240.000000 ms to retrieve 4 items.
Aug 29, 2018 10:01:55.389 [0x7fe7d97fe700] WARN - SLOW QUERY: It took 550.000000 ms to retrieve 50 items.

plex.log.gz (32.2 KB)

I’ve attached a full log file and prior to running that, I ran a full rebuild using the method here:

https://support.plex.tv/articles/201100678-repair-a-corrupt-database/#toc-2 to make sure nothing odd was going on.
Slow database queries are not related to media optimization unless you have completely maxed-out the CPU with media optimization (unlikely on a KabyLake).

If you’ve not done the normal “Optimize Database” and PMS restart (the normal first step), we will need to manually export and reimport the database at the SQL level. Export/Import also optimizes the database because of how the export (dump) process works.

Normally the butler (scheduled tasks) performs this for you but if you’ve added or moved a large amount of media at once, you’ll likely see this until the next maintenance optimization if not done manually.

Please advise results.

I’ve already executed the export/import steps as I followed the link in my OP for the export/import already and the items were noted after that.

I ran optimize just now for good measure and clicked on a scan all libraries and I get the same slow query messages:

Aug 29, 2018 10:48:00.809 [0x7f3944bfc700] INFO - SQLITE3:0x10, 17, statement aborts at 57: [select * from metadata_items limit 1] database schema has changed
Aug 29, 2018 10:48:00.811 [0x7f3944bfc700] INFO - SQLITE3:0x10, 17, statement aborts at 57: [select * from metadata_items limit 1] database schema has changed
Aug 29, 2018 10:48:00.813 [0x7f3944bfc700] INFO - SQLITE3:0x10, 17, statement aborts at 57: [select * from metadata_items limit 1] database schema has changed

Aug 29, 2018 10:48:06.973 [0x7f393dfff700] WARN - Held transaction for too long (../Library/MetadataCollection.cpp:236): 0.160000 seconds
Aug 29, 2018 10:48:07.087 [0x7f394a3ff700] WARN - SLOW QUERY: It took 260.000000 ms to retrieve 50 items.
Aug 29, 2018 10:48:11.488 [0x7f39453fd700] WARN - SLOW QUERY: It took 270.000000 ms to retrieve 4 items.
Aug 29, 2018 10:48:11.504 [0x7f3931bff700] WARN - SLOW QUERY: It took 360.000000 ms to retrieve 50 items.
Aug 29, 2018 10:48:11.843 [0x7f39473ff700] WARN - SLOW QUERY: It took 370.000000 ms to retrieve 50 items.

I use netdata/grafana and can see hardly any CPU use when that happens.

as I have:

model name : Intel(R) Core™ i7-7700 CPU @ 3.60GHz

I did note you have a KabyLake CPU.

I would prefer to see the ZIP / tar.gz of the entire Logs directory when you have an opportunity, gathered immediately after browsing around the offending library section.

If all library sections are impacted by this slow query issue then the problem clearly lies elsewhere.

What is the distribution of files per library section (approximately), e.g. of your 21000 files, if they are clustered in any particular type / section, where are they clustered?

Is networking involved?

Here is the breakdown:

29.08.2018 11:20:03 PLEX LIBRARY STATS
Media items in Libraries
Library = Movies
Items = 1936

Library = TV Shows
Items = 19433

Library = xMMA
Items = 52

Library = zExercise
Items = 279

I’ve re-ran a scan and did a refresh to generate some new slow query errors.

I do use rclone for majority of my media over a mergerfs mount.

The directory/file structures are all cached and a normal find runs fast:

felix@gemini:/gmedia$ time find . | wc -l
29272

real	0m0.248s
user	0m0.028s
sys	0m0.016s
felix@gemini:/gmedia$ time find . | wc -l
29272

real	0m0.251s
user	0m0.008s
sys	0m0.036s
felix@gemini:/gmedia$ time find . | wc -l
29272

real	0m0.262s
user	0m0.020s
sys	0m0.024s

newlogs.tar.gz (833.7 KB)

I’ve added the complete log zip as well to.

Thanks for that info. I can better sink my teeth into it.

A kernel cached directory read (the find timing results) means nothing. You’re simply reporting kernel response time.

Mergerfs is a FUSE for the media. Where’s the Plex database (normally in /var/lib/plexmediaserver) ?

My entire root / (which has /var/lib/plexmediaserver ) is on SSD.

My entire library is on my GD via rclone/mergerfs minus a very tiny portion on local storage until it’s moved to the cloud every night.

Is there anyway to see what those items are doing? I have debug and verbose on yet I can’t see any detail on that item is doing.

Aug 30, 2018 11:10:07.386 [0x7fcd2e3ff700] VERBOSE - It took 0.0 sec to serialize a partial list with 0 elements (0 total).
Aug 30, 2018 11:10:07.387 [0x7fcd313ff700] DEBUG - Completed: [127.0.0.1:53562] 200 GET /hubs/home/recentlyAdded?type=1&personal=1 (24 live) Page 0-15 10ms 377 bytes (pipelined: 8)
Aug 30, 2018 11:10:07.398 [0x7fcd10bfc700] DEBUG - It took 120.000000 ms to retrieve 4 items.
Aug 30, 2018 11:10:07.407 [0x7fcd04db3700] DEBUG - It took 140.000000 ms to retrieve 4 items.
Aug 30, 2018 11:10:07.409 [0x7fcd00dab700] DEBUG - It took 200.000000 ms to retrieve 4 items.
Aug 30, 2018 11:10:07.409 [0x7fcd00dab700] DEBUG - Setting container serialization range to [0, 15] (total=-1)
Aug 30, 2018 11:10:07.409 [0x7fcd00dab700] VERBOSE - It took 0.0 sec to serialize a partial list with 0 elements (0 total).
Aug 30, 2018 11:10:07.409 [0x7fcd313ff700] DEBUG - Completed: [127.0.0.1:53578] 200 GET /hubs/home/recentlyAdded?type=8 (24 live) Page 0-15 32ms 377 bytes (pipelined: 5)
Aug 30, 2018 11:10:07.422 [0x7fcd015ac700] DEBUG - Setting container serialization range to [0, 15] (total=1878)
Aug 30, 2018 11:10:07.424 [0x7fcd015ac700] VERBOSE - It took 0.0 sec to serialize a list with 16 elements.
Aug 30, 2018 11:10:07.424 [0x7fcd313ff700] DEBUG - Completed: [127.0.0.1:53576] 200 GET /hubs/home/recentlyAdded?type=1 (24 live) Page 0-15 48ms 26181 bytes (pipelined: 5)
Aug 30, 2018 11:10:07.443 [0x7fcd045b2700] WARN - SLOW QUERY: It took 480.000000 ms to retrieve 50 items.
Aug 30, 2018 11:10:07.449 [0x7fcd045b2700] DEBUG - It took 40.000000 ms to retrieve 137 items.
Aug 30, 2018 11:10:07.468 [0x7fcd045b2700] DEBUG - Setting container serialization range to [0, 15] (total=-1)
Aug 30, 2018 11:10:07.468 [0x7fcd045b2700] DEBUG - We're going to try to auto-select an audio stream for account 1.
Aug 30, 2018 11:10:07.469 [0x7fcd045b2700] DEBUG - Selecting best audio stream for part ID 23248 (autoselect: 1 language: en)
Aug 30, 2018 11:10:07.469 [0x7fcd045b2700] DEBUG - We're going to try to auto-select a subtitle.

I can’t tell if that’s slow on hitting something on a mount or possibly somewhere else. I can generate the slow messages when I click on scanning a library.

Queries happen primarily from the clients when browsing the library / retrieving information from within a section.

Here, it’s getting ready to play and retrieving the media info. This shouldn’t be slow because it’s only attempting to retrieve the specific XML record of the item you selected to play which are 3 small DB queries.

SSD means nothing here. Elapsed time does. Analogy might be Walk down the middle a row of cubicles versus winding your way around a maze of cubicles. You’ll still get to the other side but it will take longer.

Lost cycles (time) due to hw config or memory. All of this occurs below the processor level. We can’t really quantify fast vs slow RAM easily but we can easily see the difference. Tests don’t show it but elapsed time tests do. The same type relationship exists here.

If your database has been optimized, meaning all the indirection pointers internal to the DB (below what PMS knows) have been removed, and it’s still slow, we have something we can investigate.
If the db isn’t optimized, all bets are off.

The DB fragments by adding or removing media. SQLite3 is an indexed flat file. It’s highly portable but being an indexed file means the index entries are going to splatter (fragment) throughout the file. When it tries to pull the record, if it must first make 100 other retrievals just to get to the record, that’s wasted/lost time. On the SSD, there are no I/O waits. It will show as an IOPS spike before anything else.

Am I making sense?

I think I’m following as I do capture that information as well and I have that detail from netdata / grafana as well:

sda is my plex library drive as thats the 250GB ssd disk.

The only way I know to optimize is to click on the Optimize button in the menu and let it run. Is there something else I should be doing to help out? I’ve tried a few things like dropping the whole DB area in a ramdisk as well to see if that helps, but didn’t really make a difference either.

Is there any other thing to run to help optimize make it run better?

This topic was automatically closed 90 days after the last reply. New replies are no longer allowed.