Some more feedback, although not sure if there is any point as @Moussa seems to have disappeared from this thread.
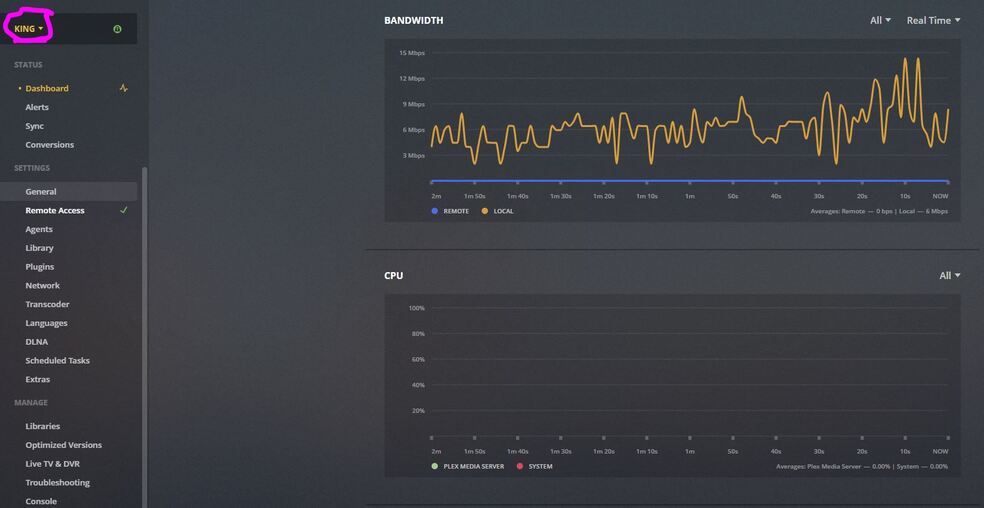
So on my servers where the graphs work, calls to get the resources:
https://REDACTED:32400/statistics/resources?timespan=6&X-Plex-Product=Plex%20Web&X-Plex-Version=3.97.4&X-Plex-Client-Identifier=REDACTED....
return the correct json e.g.
{"MediaContainer":
	{"size":64600,"StatisticsResources":[
		{"timespan":6,"at":1556449456,"hostCpuUtilization":1.602,"processCpuUtilization":0.175,"hostMemoryUtilization":35.37,"processMemoryUtilization":13.687},
		{"timespan":6,"at":1556449461,"hostCpuUtilization":1.503,"processCpuUtilization":0.05,"hostMemoryUtilization":35.371,"processMemoryUtilization":13.687}.....
But on my nas (DS1815+) the same call returns this json without any of the stats.
{"MediaContainer":
	{"size":28,"StatisticsResources":[
		{"timespan":6,"at":1556909176},
		{"timespan":6,"at":1556909181}....
As far as I can see there is nothing useful in the Plex Media Server log, all you get in there is multiple lines of this:
May 04, 2019 09:57:55.067 [0x7f9d67a23700] DEBUG - Request: [REDACTED:53058 (Subnet)] GET /statistics/resources?timespan=6 (8 live) TLS GZIP Signed-in Token (REDACTED)
May 04, 2019 09:57:55.071 [0x7f9dc9531700] DEBUG - Completed: [REDACTED:53058] 200 GET /statistics/resources?timespan=6 (8 live) TLS GZIP 4ms 551 bytes (pipelined: 185)
The one difference between the other servers, is that the one running on the NAS does not have remote access enabled, but I tried enabling that and it made no difference.


 )
)