Server Version#:1.31.3.6868-7000
Player Version#:1.67.1.3665-771934d3
<If providing server logs please do NOT turn on verbose logging, only debug logging should be enabled>
Hello, I am pasting logs here:
Apr 01, 2023 12:01:50.920 [0x7ff9bdd70b38] Debug — WebSocket: Performing handshake from origin file://
Apr 01, 2023 12:01:50.920 [0x7ff9bdd70b38] Debug — Beginning read from WebSocket
Apr 01, 2023 12:01:50.977 [0x7ff9bc745b38] Debug — Request: [192.168.1.175:62327 (Subnet)] GET /activities (8 live) #932 TLS GZIP Signed-in Token (XXXXXXXX) (XXXX-PC) / Accept => application/json / Accept-Encoding => gzip, deflate, br / Accept-Language => en / Connection => keep-alive / Host => 192-168-1-170.8dd372a1ed1e41bd91a739b833b97e82.plex.direct:32400 / Sec-Fetch-Dest => empty / Sec-Fetch-Mode => cors / Sec-Fetch-Site => cross-site / User-Agent => Plex; 1.67.1.3665-771934d3; Windows 10 Version 2009 / X-Plex-Client-Identifier => 5g02kypita58mzthoerlnaig / X-Plex-Client-Profile-Name => Plex Desktop / X-Plex-Device-Name => XXXX-PC / X-Plex-Device-Screen-Resolution => 2048x1096,2560x1440 / X-Plex-Features => external-media,indirect-media,hub-style-list / X-Plex-Language => en / X-Plex-Model => standalone / X-Plex-Platform => windows / X-Plex-Platform-Version => 10.0.22621 / X-Plex-Product => Plex for Windows / X-Plex-Token => xxxxxxxxxxxxxxxxxxxx / X-Plex-Version => 1.67.1.3665-771934d3
Apr 01, 2023 12:01:50.977 [0x7ff9bc745b38] Verbose — It took 0.0 sec to serialize a list with 0 elements.
Apr 01, 2023 12:01:50.977 [0x7ff9bfcfab38] Debug — Completed: [192.168.1.175:62327] 200 GET /activities (8 live) #932 TLS GZIP 0ms 350 bytes (pipelined: 2)
Apr 01, 2023 12:01:52.735 [0x7ff9be18fb38] Warning — [HttpClient/HCl#ad] HTTP error requesting GET http://192.168.1.254:34717/rootDesc.xml (7, Couldn’t connect to server) (Failed to connect to 192.168.1.254 port 34717: Host is unreachable)
Apr 01, 2023 12:01:52.735 [0x7ff9bc33fb38] Verbose — [NSB/SSDP] Error parsing device schema for http://192.168.1.254:34717/rootDesc.xml
Apr 01, 2023 12:01:57.657 [0x7ff9bfefdb38] Verbose — WebSocket: processed 1 frame(s)
Apr 01, 2023 12:01:59.676 [0x7ff9bfcfab38] Verbose — WebSocket: processed 1 frame(s)
Apr 01, 2023 12:02:00.922 [0x7ff9bfcfab38] Verbose — WebSocket: processed 1 frame(s)
Apr 01, 2023 12:02:07.658 [0x7ff9bfcfab38] Verbose — WebSocket: processed 1 frame(s)
Apr 01, 2023 12:02:09.677 [0x7ff9bfcfab38] Verbose — WebSocket: processed 1 frame(s)
Apr 01, 2023 12:02:10.894 [0x7ff9bfefdb38] Verbose — We didn’t receive any data from 192.168.1.175:62324 in time, dropping connection.
Apr 01, 2023 12:02:10.895 [0x7ff9bfefdb38] Verbose — We didn’t receive any data from 192.168.1.175:62326 in time, dropping connection.
Apr 01, 2023 12:02:10.900 [0x7ff9bfefdb38] Verbose — We didn’t receive any data from 192.168.1.175:62325 in time, dropping connection.
Apr 01, 2023 12:02:10.937 [0x7ff9bfefdb38] Verbose — WebSocket: processed 1 frame(s)
Apr 01, 2023 12:02:10.978 [0x7ff9bfcfab38] Verbose — We didn’t receive any data from 192.168.1.175:62327 in time, dropping connection.
Apr 01, 2023 12:02:13.897 [0x7ff9bfcfab38] Verbose — Didn’t receive a request from 192.168.1.175:62324: stream truncated
Apr 01, 2023 12:02:13.897 [0x7ff9bfcfab38] Verbose — Didn’t receive a request from 192.168.1.175:62326: stream truncated
Apr 01, 2023 12:02:13.901 [0x7ff9bfefdb38] Verbose — Didn’t receive a request from 192.168.1.175:62325: stream truncated
Apr 01, 2023 12:02:13.978 [0x7ff9bfcfab38] Verbose — Didn’t receive a request from 192.168.1.175:62327: stream truncated
Apr 01, 2023 12:02:17.659 [0x7ff9bfcfab38] Verbose — WebSocket: processed 1 frame(s)
Apr 01, 2023 12:02:19.678 [0x7ff9bfefdb38] Verbose — WebSocket: processed 1 frame(s)
Apr 01, 2023 12:02:20.924 [0x7ff9bfefdb38] Verbose — WebSocket: processed 1 frame(s)
Apr 01, 2023 12:02:27.660 [0x7ff9bfefdb38] Verbose — WebSocket: processed 1 frame(s)
Apr 01, 2023 12:02:29.678 [0x7ff9bfcfab38] Verbose — WebSocket: processed 1 frame(s)
Apr 01, 2023 12:02:29.722 [0x7ff9bc33fb38] Debug — [NSB/SSDP] Parsing SSDP schema for http://192.168.1.254:34717/rootDesc.xml
Apr 01, 2023 12:02:29.722 [0x7ff9bc33fb38] Verbose — [NSB/SSDP/HCl#af] HTTP requesting GET http://192.168.1.254:34717/rootDesc.xml
Apr 01, 2023 12:02:30.925 [0x7ff9bfcfab38] Verbose — WebSocket: processed 1 frame(s)
Apr 01, 2023 12:02:32.731 [0x7ff9be18fb38] Warning — [HttpClient/HCl#af] HTTP error requesting GET http://192.168.1.254:34717/rootDesc.xml (7, Couldn’t connect to server) (Failed to connect to 192.168.1.254 port 34717: Host is unreachable)
Apr 01, 2023 12:02:32.731 [0x7ff9bc33fb38] Verbose — [NSB/SSDP] Error parsing device schema for http://192.168.1.254:34717/rootDesc.xml
Apr 01, 2023 12:02:37.661 [0x7ff9bfcfab38] Verbose — WebSocket: processed 1 frame(s)
Apr 01, 2023 12:02:39.679 [0x7ff9bfcfab38] Verbose — WebSocket: processed 1 frame(s)
Apr 01, 2023 12:02:40.926 [0x7ff9bfcfab38] Verbose — WebSocket: processed 1 frame(s)
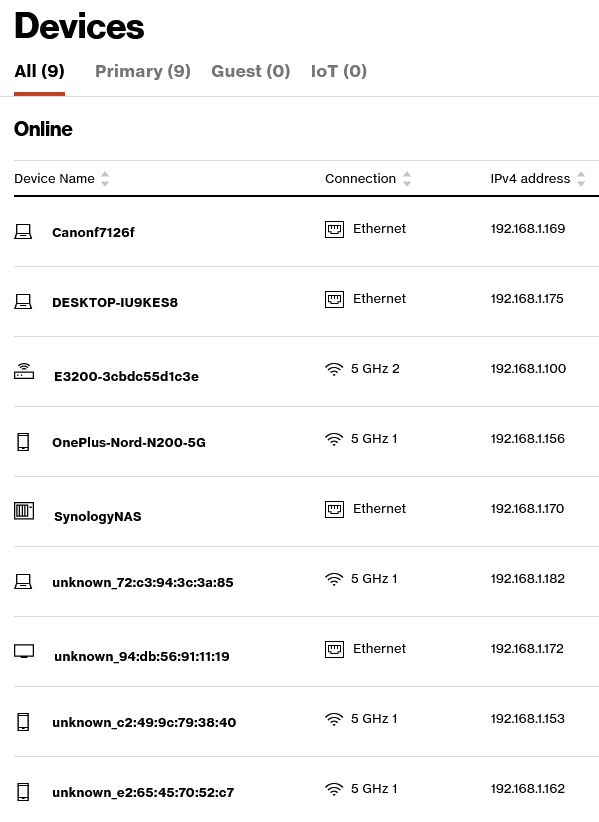
As you can see I am getting a strange request for a local IP that I cannot identify. I am looking at my Fios router devices and none of them are logged at .254. This keeps cycling over and over. What is happening?
Let me add I replaced my username/PC name with the "XXX"s
Verbose makes so much noise that you can’t tell what’s really happening.
What I see looks like a noisy SSDP response from that IP address on your home LAN.
(some modem/routers use the ‘.254’ address as the gateway discovery address)
Here is where it’s reaching out to it – as if it’s a server (port 34717)
Apr 01, 2023 13:12:16.615 [0x7f434962db38] WARN - [HttpClient/HCl#3d] HTTP error requesting GET http://192.168.1.254:34717/rootDesc.xml (7, Couldn’t connect to server) (Failed to connect to 192.168.1.254 port 34717: Host is unreachable)
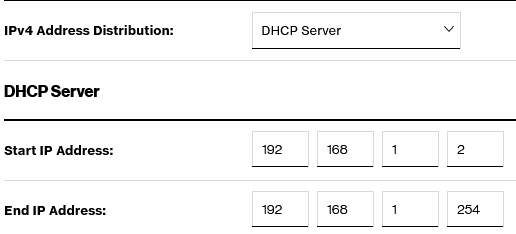
192.168.1.1 is what I use to login to the router itself (Fios). There is also a gateway/extender at 192.168.1.100. The DHCP distribution goes from 192.168.1.2 to 192.168.1.254. It is this .254 address that seems to keep coming up.
It finds all devices responding to the scan and tells me everything it can about it.
My filter is to hide ‘host down’ responses (no reply)
It has a ton of options to do all kinds of sweeps
There should be an equivalent for Windows and MacOS
Here’s the scan for my LAN.
The order (each block) is:
hostname with IP
status (up)
MAC address
[chuck@lizum ~.2005]$ netscan
Starting Nmap 7.80 ( https://nmap.org ) at 2023-04-01 16:36 EDT
Initiating ARP Ping Scan at 16:36
Scanning 255 hosts [1 port/host]
Completed ARP Ping Scan at 16:36, 1.34s elapsed (255 total hosts)
Initiating Parallel DNS resolution of 255 hosts. at 16:36
Completed Parallel DNS resolution of 255 hosts. at 16:36, 0.00s elapsed
Nmap scan report for pfsense (192.168.0.1)
Host is up (0.000098s latency).
MAC Address: 68:05:CA:DF:3B:07 (Intel Corporate)
Nmap scan report for netgear (192.168.0.3)
Host is up (0.0010s latency).
MAC Address: CC:40:D0:4F:31:52 (Netgear)
Nmap scan report for xs724 (192.168.0.4)
Host is up (0.014s latency).
MAC Address: 94:A6:7E:78:EA:98 (Unknown)
Nmap scan report for wifi (192.168.0.5)
Host is up (0.00048s latency).
MAC Address: 94:A6:7E:00:8A:95 (Unknown)
Nmap scan report for gerbil (192.168.0.16)
Host is up (0.00058s latency).
MAC Address: F4:4D:30:6C:49:CE (Elitegroup Computer Systems)
Nmap scan report for glock (192.168.0.20)
Host is up (0.00042s latency).
MAC Address: C2:E5:24:D2:0F:8C (Unknown)
Nmap scan report for onkyo (192.168.0.30)
Host is up (0.00026s latency).
MAC Address: 00:09:B0:E3:DD:00 (Onkyo)
Nmap scan report for chuckipad (192.168.0.32)
Host is up (0.077s latency).
MAC Address: 60:8C:4A:7A:D0:B8 (Apple)
Nmap scan report for ultra (192.168.0.35)
Host is up (0.0058s latency).
MAC Address: BC:D7:D4:38:C9:0C (Unknown)
Nmap scan report for shield (192.168.0.40)
Host is up (0.00019s latency).
MAC Address: 00:04:4B:E9:44:50 (Nvidia)
Nmap scan report for tv-lg-wifi (192.168.0.43)
Host is up (0.051s latency).
MAC Address: 4C:BC:E9:01:7C:76 (Unknown)
Nmap scan report for vole (192.168.0.50)
Host is up (0.00022s latency).
MAC Address: 54:B2:03:11:BF:3E (Pegatron)
Nmap scan report for ts128 (192.168.0.70)
Host is up (0.00013s latency).
MAC Address: 24:5E:BE:3C:8E:FF (Qnap Systems)
Nmap scan report for ds418 (192.168.0.71)
Host is up (0.00011s latency).
MAC Address: 00:11:32:6D:BC:BF (Synology Incorporated)
Nmap scan report for lxd (192.168.0.80)
Host is up (0.00050s latency).
MAC Address: 00:16:3E:2A:47:52 (Xensource)
Nmap scan report for media (192.168.0.81)
Host is up (0.00050s latency).
MAC Address: 00:16:3E:84:91:E6 (Xensource)
Nmap scan report for librenms (192.168.0.84)
Host is up (0.00050s latency).
MAC Address: 00:16:3E:D1:BE:2A (Xensource)
Nmap scan report for homebridge (192.168.0.85)
Host is up (0.00050s latency).
MAC Address: 00:16:3E:B9:27:26 (Xensource)
Nmap scan report for appletv (192.168.0.96)
Host is up (0.030s latency).
MAC Address: DC:56:E7:33:3B:21 (Apple)
Nmap scan report for 001788b33d18 (192.168.0.179)
Host is up (0.00015s latency).
MAC Address: 00:17:88:B3:3D:18 (Philips Lighting BV)
Nmap scan report for 192.168.0.200
Host is up (0.00069s latency).
MAC Address: AC:1F:6B:EC:C0:AA (Super Micro Computer)
Nmap scan report for 192.168.0.215
Host is up (0.046s latency).
MAC Address: 48:B0:2D:B2:85:16 (Unknown)
Nmap scan report for pvebuntu (192.168.0.216)
Host is up (0.00044s latency).
MAC Address: 9E:83:86:0E:E9:FE (Unknown)
Nmap scan report for freebsd (192.168.0.217)
Host is up (0.00022s latency).
MAC Address: 00:0C:29:08:6F:2C (VMware)
Nmap scan report for 192.168.0.229
Host is up (0.015s latency).
MAC Address: 62:18:7F:59:AC:5E (Unknown)
Nmap scan report for LivingRoom (192.168.0.239)
Host is up (0.054s latency).
MAC Address: 40:CB:C0:E5:CD:FE (Apple)
Nmap scan report for Roku3-350 (192.168.0.242)
Host is up (0.11s latency).
MAC Address: B8:3E:59:AF:81:97 (Roku)
Initiating Parallel DNS resolution of 1 host. at 16:36
Completed Parallel DNS resolution of 1 host. at 16:36, 0.00s elapsed
Nmap scan report for lizum (192.168.0.13)
Host is up.
Read data files from: /usr/bin/../share/nmap
Nmap done: 256 IP addresses (28 hosts up) scanned in 1.43 seconds
           Raw packets sent: 484 (13.552KB) | Rcvd: 28 (784B)
[chuck@lizum ~.2006]$
Apologies as this is not something I’m too familiar with. What precisely should I enter in order for you to see what you’re looking for on my machine? If I simply scan the .254 I get the following:
C:>nmap 192.168.1.254
Starting Nmap 7.93 ( https://nmap.org ) at 2023-04-01 18:10 Eastern Daylight Time
Note: Host seems down. If it is really up, but blocking our ping probes, try -Pn
Nmap done: 1 IP address (0 hosts up) scanned in 1.54 seconds
C:>nmap -v 192.168.1.1/24
Starting Nmap 7.93 ( https://nmap.org ) at 2023-04-01 18:21 Eastern Daylight Time
Initiating ARP Ping Scan at 18:21
Scanning 255 hosts [1 port/host]
Completed ARP Ping Scan at 18:21, 2.75s elapsed (255 total hosts)
Initiating Parallel DNS resolution of 9 hosts. at 18:21
Completed Parallel DNS resolution of 9 hosts. at 18:21, 0.00s elapsed
Nmap scan report for 192.168.1.0 [host down]
Nmap scan report for 192.168.1.2 [host down]
Nmap scan report for 192.168.1.3 [host down]
Nmap scan report for 192.168.1.4 [host down]
Nmap scan report for 192.168.1.5 [host down]
Nmap scan report for 192.168.1.6 [host down]
Nmap scan report for 192.168.1.7 [host down]
Nmap scan report for 192.168.1.8 [host down]
Nmap scan report for 192.168.1.9 [host down]
Nmap scan report for 192.168.1.10 [host down]
Nmap scan report for 192.168.1.11 [host down]
Nmap scan report for 192.168.1.12 [host down]
Nmap scan report for 192.168.1.13 [host down]
Nmap scan report for 192.168.1.14 [host down]
Nmap scan report for 192.168.1.15 [host down]
Nmap scan report for 192.168.1.16 [host down]
Nmap scan report for 192.168.1.17 [host down]
Nmap scan report for 192.168.1.18 [host down]
Nmap scan report for 192.168.1.19 [host down]
Nmap scan report for 192.168.1.20 [host down]
Nmap scan report for 192.168.1.21 [host down]
Nmap scan report for 192.168.1.22 [host down]
Nmap scan report for 192.168.1.23 [host down]
Nmap scan report for 192.168.1.24 [host down]
Nmap scan report for 192.168.1.25 [host down]
Nmap scan report for 192.168.1.26 [host down]
Nmap scan report for 192.168.1.27 [host down]
Nmap scan report for 192.168.1.28 [host down]
Nmap scan report for 192.168.1.29 [host down]
Nmap scan report for 192.168.1.30 [host down]
Nmap scan report for 192.168.1.31 [host down]
Nmap scan report for 192.168.1.32 [host down]
Nmap scan report for 192.168.1.33 [host down]
Nmap scan report for 192.168.1.34 [host down]
Nmap scan report for 192.168.1.35 [host down]
Nmap scan report for 192.168.1.36 [host down]
Nmap scan report for 192.168.1.37 [host down]
Nmap scan report for 192.168.1.38 [host down]
Nmap scan report for 192.168.1.39 [host down]
Nmap scan report for 192.168.1.40 [host down]
Nmap scan report for 192.168.1.41 [host down]
Nmap scan report for 192.168.1.42 [host down]
Nmap scan report for 192.168.1.43 [host down]
Nmap scan report for 192.168.1.44 [host down]
Nmap scan report for 192.168.1.45 [host down]
Nmap scan report for 192.168.1.46 [host down]
Nmap scan report for 192.168.1.47 [host down]
Nmap scan report for 192.168.1.48 [host down]
Nmap scan report for 192.168.1.49 [host down]
Nmap scan report for 192.168.1.50 [host down]
Nmap scan report for 192.168.1.51 [host down]
Nmap scan report for 192.168.1.52 [host down]
Nmap scan report for 192.168.1.53 [host down]
Nmap scan report for 192.168.1.54 [host down]
Nmap scan report for 192.168.1.55 [host down]
Nmap scan report for 192.168.1.56 [host down]
Nmap scan report for 192.168.1.57 [host down]
Nmap scan report for 192.168.1.58 [host down]
Nmap scan report for 192.168.1.59 [host down]
Nmap scan report for 192.168.1.60 [host down]
Nmap scan report for 192.168.1.61 [host down]
Nmap scan report for 192.168.1.62 [host down]
Nmap scan report for 192.168.1.63 [host down]
Nmap scan report for 192.168.1.64 [host down]
Nmap scan report for 192.168.1.65 [host down]
Nmap scan report for 192.168.1.66 [host down]
Nmap scan report for 192.168.1.67 [host down]
Nmap scan report for 192.168.1.68 [host down]
Nmap scan report for 192.168.1.69 [host down]
Nmap scan report for 192.168.1.70 [host down]
Nmap scan report for 192.168.1.71 [host down]
Nmap scan report for 192.168.1.72 [host down]
Nmap scan report for 192.168.1.73 [host down]
Nmap scan report for 192.168.1.74 [host down]
Nmap scan report for 192.168.1.75 [host down]
Nmap scan report for 192.168.1.76 [host down]
Nmap scan report for 192.168.1.77 [host down]
Nmap scan report for 192.168.1.78 [host down]
Nmap scan report for 192.168.1.79 [host down]
Nmap scan report for 192.168.1.80 [host down]
Nmap scan report for 192.168.1.81 [host down]
Nmap scan report for 192.168.1.82 [host down]
Nmap scan report for 192.168.1.83 [host down]
Nmap scan report for 192.168.1.84 [host down]
Nmap scan report for 192.168.1.85 [host down]
Nmap scan report for 192.168.1.86 [host down]
Nmap scan report for 192.168.1.87 [host down]
Nmap scan report for 192.168.1.88 [host down]
Nmap scan report for 192.168.1.89 [host down]
Nmap scan report for 192.168.1.90 [host down]
Nmap scan report for 192.168.1.91 [host down]
Nmap scan report for 192.168.1.92 [host down]
Nmap scan report for 192.168.1.93 [host down]
Nmap scan report for 192.168.1.94 [host down]
Nmap scan report for 192.168.1.95 [host down]
Nmap scan report for 192.168.1.96 [host down]
Nmap scan report for 192.168.1.97 [host down]
Nmap scan report for 192.168.1.98 [host down]
Nmap scan report for 192.168.1.99 [host down]
Nmap scan report for 192.168.1.101 [host down]
Nmap scan report for 192.168.1.102 [host down]
Nmap scan report for 192.168.1.103 [host down]
Nmap scan report for 192.168.1.104 [host down]
Nmap scan report for 192.168.1.105 [host down]
Nmap scan report for 192.168.1.106 [host down]
Nmap scan report for 192.168.1.107 [host down]
Nmap scan report for 192.168.1.108 [host down]
Nmap scan report for 192.168.1.109 [host down]
Nmap scan report for 192.168.1.110 [host down]
Nmap scan report for 192.168.1.111 [host down]
Nmap scan report for 192.168.1.112 [host down]
Nmap scan report for 192.168.1.113 [host down]
Nmap scan report for 192.168.1.114 [host down]
Nmap scan report for 192.168.1.115 [host down]
Nmap scan report for 192.168.1.116 [host down]
Nmap scan report for 192.168.1.117 [host down]
Nmap scan report for 192.168.1.118 [host down]
Nmap scan report for 192.168.1.119 [host down]
Nmap scan report for 192.168.1.120 [host down]
Nmap scan report for 192.168.1.121 [host down]
Nmap scan report for 192.168.1.122 [host down]
Nmap scan report for 192.168.1.123 [host down]
Nmap scan report for 192.168.1.124 [host down]
Nmap scan report for 192.168.1.125 [host down]
Nmap scan report for 192.168.1.126 [host down]
Nmap scan report for 192.168.1.127 [host down]
Nmap scan report for 192.168.1.128 [host down]
Nmap scan report for 192.168.1.129 [host down]
Nmap scan report for 192.168.1.130 [host down]
Nmap scan report for 192.168.1.131 [host down]
Nmap scan report for 192.168.1.132 [host down]
Nmap scan report for 192.168.1.133 [host down]
Nmap scan report for 192.168.1.134 [host down]
Nmap scan report for 192.168.1.135 [host down]
Nmap scan report for 192.168.1.136 [host down]
Nmap scan report for 192.168.1.137 [host down]
Nmap scan report for 192.168.1.138 [host down]
Nmap scan report for 192.168.1.139 [host down]
Nmap scan report for 192.168.1.140 [host down]
Nmap scan report for 192.168.1.141 [host down]
Nmap scan report for 192.168.1.142 [host down]
Nmap scan report for 192.168.1.143 [host down]
Nmap scan report for 192.168.1.144 [host down]
Nmap scan report for 192.168.1.145 [host down]
Nmap scan report for 192.168.1.146 [host down]
Nmap scan report for 192.168.1.147 [host down]
Nmap scan report for 192.168.1.148 [host down]
Nmap scan report for 192.168.1.149 [host down]
Nmap scan report for 192.168.1.150 [host down]
Nmap scan report for 192.168.1.151 [host down]
Nmap scan report for 192.168.1.152 [host down]
Nmap scan report for 192.168.1.154 [host down]
Nmap scan report for 192.168.1.155 [host down]
Nmap scan report for 192.168.1.156 [host down]
Nmap scan report for 192.168.1.157 [host down]
Nmap scan report for 192.168.1.158 [host down]
Nmap scan report for 192.168.1.159 [host down]
Nmap scan report for 192.168.1.160 [host down]
Nmap scan report for 192.168.1.161 [host down]
Nmap scan report for 192.168.1.164 [host down]
Nmap scan report for 192.168.1.165 [host down]
Nmap scan report for 192.168.1.166 [host down]
Nmap scan report for 192.168.1.167 [host down]
Nmap scan report for 192.168.1.168 [host down]
Nmap scan report for 192.168.1.171 [host down]
Nmap scan report for 192.168.1.173 [host down]
Nmap scan report for 192.168.1.174 [host down]
Nmap scan report for 192.168.1.176 [host down]
Nmap scan report for 192.168.1.177 [host down]
Nmap scan report for 192.168.1.178 [host down]
Nmap scan report for 192.168.1.179 [host down]
Nmap scan report for 192.168.1.180 [host down]
Nmap scan report for 192.168.1.181 [host down]
Nmap scan report for 192.168.1.183 [host down]
Nmap scan report for 192.168.1.184 [host down]
Nmap scan report for 192.168.1.185 [host down]
Nmap scan report for 192.168.1.186 [host down]
Nmap scan report for 192.168.1.187 [host down]
Nmap scan report for 192.168.1.188 [host down]
Nmap scan report for 192.168.1.189 [host down]
Nmap scan report for 192.168.1.190 [host down]
Nmap scan report for 192.168.1.191 [host down]
Nmap scan report for 192.168.1.192 [host down]
Nmap scan report for 192.168.1.193 [host down]
Nmap scan report for 192.168.1.194 [host down]
Nmap scan report for 192.168.1.195 [host down]
Nmap scan report for 192.168.1.196 [host down]
Nmap scan report for 192.168.1.197 [host down]
Nmap scan report for 192.168.1.198 [host down]
Nmap scan report for 192.168.1.199 [host down]
Nmap scan report for 192.168.1.200 [host down]
Nmap scan report for 192.168.1.201 [host down]
Nmap scan report for 192.168.1.202 [host down]
Nmap scan report for 192.168.1.203 [host down]
Nmap scan report for 192.168.1.204 [host down]
Nmap scan report for 192.168.1.205 [host down]
Nmap scan report for 192.168.1.206 [host down]
Nmap scan report for 192.168.1.207 [host down]
Nmap scan report for 192.168.1.208 [host down]
Nmap scan report for 192.168.1.209 [host down]
Nmap scan report for 192.168.1.210 [host down]
Nmap scan report for 192.168.1.211 [host down]
Nmap scan report for 192.168.1.212 [host down]
Nmap scan report for 192.168.1.213 [host down]
Nmap scan report for 192.168.1.214 [host down]
Nmap scan report for 192.168.1.215 [host down]
Nmap scan report for 192.168.1.216 [host down]
Nmap scan report for 192.168.1.217 [host down]
Nmap scan report for 192.168.1.218 [host down]
Nmap scan report for 192.168.1.219 [host down]
Nmap scan report for 192.168.1.220 [host down]
Nmap scan report for 192.168.1.221 [host down]
Nmap scan report for 192.168.1.222 [host down]
Nmap scan report for 192.168.1.223 [host down]
Nmap scan report for 192.168.1.224 [host down]
Nmap scan report for 192.168.1.225 [host down]
Nmap scan report for 192.168.1.226 [host down]
Nmap scan report for 192.168.1.227 [host down]
Nmap scan report for 192.168.1.228 [host down]
Nmap scan report for 192.168.1.229 [host down]
Nmap scan report for 192.168.1.230 [host down]
Nmap scan report for 192.168.1.231 [host down]
Nmap scan report for 192.168.1.232 [host down]
Nmap scan report for 192.168.1.233 [host down]
Nmap scan report for 192.168.1.234 [host down]
Nmap scan report for 192.168.1.235 [host down]
Nmap scan report for 192.168.1.236 [host down]
Nmap scan report for 192.168.1.237 [host down]
Nmap scan report for 192.168.1.238 [host down]
Nmap scan report for 192.168.1.239 [host down]
Nmap scan report for 192.168.1.240 [host down]
Nmap scan report for 192.168.1.241 [host down]
Nmap scan report for 192.168.1.242 [host down]
Nmap scan report for 192.168.1.243 [host down]
Nmap scan report for 192.168.1.244 [host down]
Nmap scan report for 192.168.1.245 [host down]
Nmap scan report for 192.168.1.246 [host down]
Nmap scan report for 192.168.1.247 [host down]
Nmap scan report for 192.168.1.248 [host down]
Nmap scan report for 192.168.1.249 [host down]
Nmap scan report for 192.168.1.250 [host down]
Nmap scan report for 192.168.1.251 [host down]
Nmap scan report for 192.168.1.252 [host down]
Nmap scan report for 192.168.1.253 [host down]
Nmap scan report for 192.168.1.254 [host down]
Nmap scan report for 192.168.1.255 [host down]
Initiating Parallel DNS resolution of 1 host. at 18:21
Completed Parallel DNS resolution of 1 host. at 18:21, 0.00s elapsed
Initiating SYN Stealth Scan at 18:21
Scanning 9 hosts [1000 ports/host]
Discovered open port 445/tcp on 192.168.1.170
Discovered open port 53/tcp on 192.168.1.1
Discovered open port 443/tcp on 192.168.1.100
Discovered open port 443/tcp on 192.168.1.1
Discovered open port 443/tcp on 192.168.1.169
Discovered open port 443/tcp on 192.168.1.170
Discovered open port 139/tcp on 192.168.1.170
Discovered open port 80/tcp on 192.168.1.1
Discovered open port 80/tcp on 192.168.1.169
Discovered open port 80/tcp on 192.168.1.170
Discovered open port 80/tcp on 192.168.1.100
Discovered open port 80/tcp on 192.168.1.172
Discovered open port 22/tcp on 192.168.1.170
Discovered open port 8008/tcp on 192.168.1.172
Discovered open port 62078/tcp on 192.168.1.162
Discovered open port 8443/tcp on 192.168.1.172
Discovered open port 515/tcp on 192.168.1.169
Discovered open port 8009/tcp on 192.168.1.172
Discovered open port 5357/tcp on 192.168.1.170
Discovered open port 32781/tcp on 192.168.1.172
Discovered open port 5000/tcp on 192.168.1.170
Discovered open port 49153/tcp on 192.168.1.170
Discovered open port 9000/tcp on 192.168.1.172
Discovered open port 5001/tcp on 192.168.1.170
Discovered open port 3261/tcp on 192.168.1.170
Discovered open port 631/tcp on 192.168.1.169
Discovered open port 4567/tcp on 192.168.1.100
Discovered open port 9100/tcp on 192.168.1.169
Discovered open port 7000/tcp on 192.168.1.172
Discovered open port 49152/tcp on 192.168.1.162
Completed SYN Stealth Scan against 192.168.1.100 in 1.11s (8 hosts left)
Completed SYN Stealth Scan against 192.168.1.162 in 1.11s (7 hosts left)
Completed SYN Stealth Scan against 192.168.1.170 in 1.11s (6 hosts left)
Completed SYN Stealth Scan against 192.168.1.172 in 1.11s (5 hosts left)
Completed SYN Stealth Scan against 192.168.1.1 in 1.12s (4 hosts left)
Completed SYN Stealth Scan against 192.168.1.169 in 1.12s (3 hosts left)
Increasing send delay for 192.168.1.182 from 0 to 5 due to 49 out of 163 dropped probes since last increase.
Increasing send delay for 192.168.1.182 from 5 to 10 due to 29 out of 96 dropped probes since last increase.
Increasing send delay for 192.168.1.182 from 10 to 20 due to 11 out of 11 dropped probes since last increase.
Increasing send delay for 192.168.1.182 from 20 to 40 due to 11 out of 12 dropped probes since last increase.
Increasing send delay for 192.168.1.153 from 0 to 5 due to 13 out of 43 dropped probes since last increase.
Increasing send delay for 192.168.1.153 from 5 to 10 due to 11 out of 11 dropped probes since last increase.
Increasing send delay for 192.168.1.153 from 10 to 20 due to 11 out of 11 dropped probes since last increase.
Increasing send delay for 192.168.1.182 from 40 to 80 due to 11 out of 11 dropped probes since last increase.
Increasing send delay for 192.168.1.153 from 20 to 40 due to 11 out of 12 dropped probes since last increase.
SYN Stealth Scan Timing: About 72.68% done; ETC: 18:22 (0:00:30 remaining)
Increasing send delay for 192.168.1.153 from 40 to 80 due to 11 out of 12 dropped probes since last increase.
Increasing send delay for 192.168.1.182 from 80 to 160 due to 11 out of 11 dropped probes since last increase.
SYN Stealth Scan Timing: About 73.57% done; ETC: 18:23 (0:00:40 remaining)
Increasing send delay for 192.168.1.182 from 160 to 320 due to 11 out of 11 dropped probes since last increase.
Discovered open port 62078/tcp on 192.168.1.153
SYN Stealth Scan Timing: About 76.31% done; ETC: 18:24 (0:00:47 remaining)
Increasing send delay for 192.168.1.182 from 320 to 640 due to 11 out of 11 dropped probes since last increase.
SYN Stealth Scan Timing: About 79.57% done; ETC: 18:25 (0:00:51 remaining)
Discovered open port 9001/tcp on 192.168.1.163
Completed SYN Stealth Scan against 192.168.1.163 in 251.29s (2 hosts left)
SYN Stealth Scan Timing: About 87.12% done; ETC: 18:26 (0:00:38 remaining)
Increasing send delay for 192.168.1.182 from 640 to 1000 due to 11 out of 11 dropped probes since last increase.
SYN Stealth Scan Timing: About 90.41% done; ETC: 18:26 (0:00:31 remaining)
SYN Stealth Scan Timing: About 91.18% done; ETC: 18:27 (0:00:32 remaining)
SYN Stealth Scan Timing: About 91.94% done; ETC: 18:27 (0:00:31 remaining)
SYN Stealth Scan Timing: About 92.70% done; ETC: 18:28 (0:00:31 remaining)
Increasing send delay for 192.168.1.153 from 80 to 160 due to max_successful_tryno increase to 4
Increasing send delay for 192.168.1.153 from 160 to 320 due to 11 out of 11 dropped probes since last increase.
SYN Stealth Scan Timing: About 92.17% done; ETC: 18:28 (0:00:36 remaining)
Increasing send delay for 192.168.1.153 from 320 to 640 due to 11 out of 11 dropped probes since last increase.
SYN Stealth Scan Timing: About 92.36% done; ETC: 18:29 (0:00:38 remaining)
SYN Stealth Scan Timing: About 92.54% done; ETC: 18:30 (0:00:40 remaining)
Increasing send delay for 192.168.1.153 from 640 to 1000 due to 11 out of 11 dropped probes since last increase.
SYN Stealth Scan Timing: About 92.86% done; ETC: 18:30 (0:00:42 remaining)
SYN Stealth Scan Timing: About 93.44% done; ETC: 18:31 (0:00:41 remaining)
SYN Stealth Scan Timing: About 94.04% done; ETC: 18:32 (0:00:40 remaining)
SYN Stealth Scan Timing: About 94.30% done; ETC: 18:33 (0:00:41 remaining)
I am concerned that this is also why I am unable to get any of my downloads to work. RIght now my downloads are simply bricked and not moving. Earlier today I was getting an error stating “Data transfer failed.” I don’t know why all of a sudden all of these issues are cropping up. I have tried uninstalling and reinstalling everything: Plex server on Synology, Plex on Windows, Plex on iOS. At another point today, Remote Access was cycling between red and green. What is up with this app?