Repeating error - HTTP error requesting GET http://192.168.1.88:49152/description.xml

Server Version#: 1.13.8.5395
Player Version#: 3.69.1

I’ve been reviewing the logs of a new server I just setup. I have experienced this on an old server so was hoping this would be resolved with the new setup but apparently it’s not.

It’s literally spamming my log files multiple times a minute. Funny thing is, I can’t ping the ip address, my UTM doesn’t even report the IP address being registered in the licensing. So I have no idea where this is coming from. I tried checking debug and verbose logging for more info, and only thing I saw was related to SSDP.

Sep 23, 2018 23:44:23.002 [0x7f9fadbff700] DEBUG - NetworkServiceBrowser: Parsing SSDP schema for http://192.168.1.88:49152/description.xml
Sep 23, 2018 23:44:23.002 [0x7f9fadbff700] DEBUG - HTTP requesting GET http://192.168.1.88:49152/description.xml
Sep 23, 2018 23:44:23.088 [0x7f9fb5bfe700] VERBOSE - WebSocket: processed 1 frame(s)
Sep 23, 2018 23:44:26.068 [0x7f9fadbff700] ERROR - Error issuing curl_easy_perform(handle): 7
Sep 23, 2018 23:44:26.068 [0x7f9fadbff700] WARN - HTTP error requesting GET http://192.168.1.88:49152/description.xml (0, No error) (Failed connect to 192.168.1.88:49152; No route to host)
Sep 23, 2018 23:44:26.069 [0x7f9fadbff700] DEBUG - NetworkServiceBrowser: found 0 SSDP devices via http://192.168.1.88:49152/description.xml

What on earth would be causing plex to try a get against that address? Any thoughts on how I can debug this?

Here’s the example of the log for 1 minute:
Sep 23, 2018 23:47:00.468 [0x7f9fadbff700] ERROR - Error issuing curl_easy_perform(handle): 7
Sep 23, 2018 23:47:00.468 [0x7f9fadbff700] WARN - HTTP error requesting GET http://192.168.1.88:49152/description.xml (0, No error) (Failed connect to 192.168.1.88:49152; No route to host)
Sep 23, 2018 23:47:03.540 [0x7f9fadbff700] ERROR - Error issuing curl_easy_perform(handle): 7
Sep 23, 2018 23:47:03.540 [0x7f9fadbff700] WARN - HTTP error requesting GET http://192.168.1.88:49152/description.xml (0, No error) (Failed connect to 192.168.1.88:49152; No route to host)
Sep 23, 2018 23:47:10.356 [0x7f9fadbff700] ERROR - Error issuing curl_easy_perform(handle): 7
Sep 23, 2018 23:47:10.356 [0x7f9fadbff700] WARN - HTTP error requesting GET http://192.168.1.88:49152/description.xml (0, No error) (Failed connect to 192.168.1.88:49152; No route to host)
Sep 23, 2018 23:47:13.428 [0x7f9fadbff700] ERROR - Error issuing curl_easy_perform(handle): 7
Sep 23, 2018 23:47:13.428 [0x7f9fadbff700] WARN - HTTP error requesting GET http://192.168.1.88:49152/description.xml (0, No error) (Failed connect to 192.168.1.88:49152; No route to host)
Sep 23, 2018 23:47:16.500 [0x7f9fadbff700] ERROR - Error issuing curl_easy_perform(handle): 7
Sep 23, 2018 23:47:16.500 [0x7f9fadbff700] WARN - HTTP error requesting GET http://192.168.1.88:49152/description.xml (0, No error) (Failed connect to 192.168.1.88:49152; No route to host)
Sep 23, 2018 23:47:19.572 [0x7f9fadbff700] ERROR - Error issuing curl_easy_perform(handle): 7
Sep 23, 2018 23:47:19.572 [0x7f9fadbff700] WARN - HTTP error requesting GET http://192.168.1.88:49152/description.xml (0, No error) (Failed connect to 192.168.1.88:49152; No route to host)
Sep 23, 2018 23:47:28.788 [0x7f9fadbff700] ERROR - Error issuing curl_easy_perform(handle): 7
Sep 23, 2018 23:47:28.788 [0x7f9fadbff700] WARN - HTTP error requesting GET http://192.168.1.88:49152/description.xml (0, No error) (Failed connect to 192.168.1.88:49152; No route to host)
Sep 23, 2018 23:47:31.860 [0x7f9fadbff700] ERROR - Error issuing curl_easy_perform(handle): 7
Sep 23, 2018 23:47:31.860 [0x7f9fadbff700] WARN - HTTP error requesting GET http://192.168.1.88:49152/description.xml (0, No error) (Failed connect to 192.168.1.88:49152; No route to host)
Sep 23, 2018 23:47:34.932 [0x7f9fadbff700] ERROR - Error issuing curl_easy_perform(handle): 7
Sep 23, 2018 23:47:34.932 [0x7f9fadbff700] WARN - HTTP error requesting GET http://192.168.1.88:49152/description.xml (0, No error) (Failed connect to 192.168.1.88:49152; No route to host)
Sep 23, 2018 23:47:38.004 [0x7f9fadbff700] ERROR - Error issuing curl_easy_perform(handle): 7
Sep 23, 2018 23:47:38.004 [0x7f9fadbff700] WARN - HTTP error requesting GET http://192.168.1.88:49152/description.xml (0, No error) (Failed connect to 192.168.1.88:49152; No route to host)
Sep 23, 2018 23:47:54.292 [0x7f9fadbff700] ERROR - Error issuing curl_easy_perform(handle): 7
Sep 23, 2018 23:47:54.292 [0x7f9fadbff700] WARN - HTTP error requesting GET http://192.168.1.88:49152/description.xml (0, No error) (Failed connect to 192.168.1.88:49152; No route to host)
Sep 23, 2018 23:47:57.364 [0x7f9fadbff700] ERROR - Error issuing curl_easy_perform(handle): 7
Sep 23, 2018 23:47:57.364 [0x7f9fadbff700] WARN - HTTP error requesting GET http://192.168.1.88:49152/description.xml (0, No error) (Failed connect to 192.168.1.88:49152; No route to host)

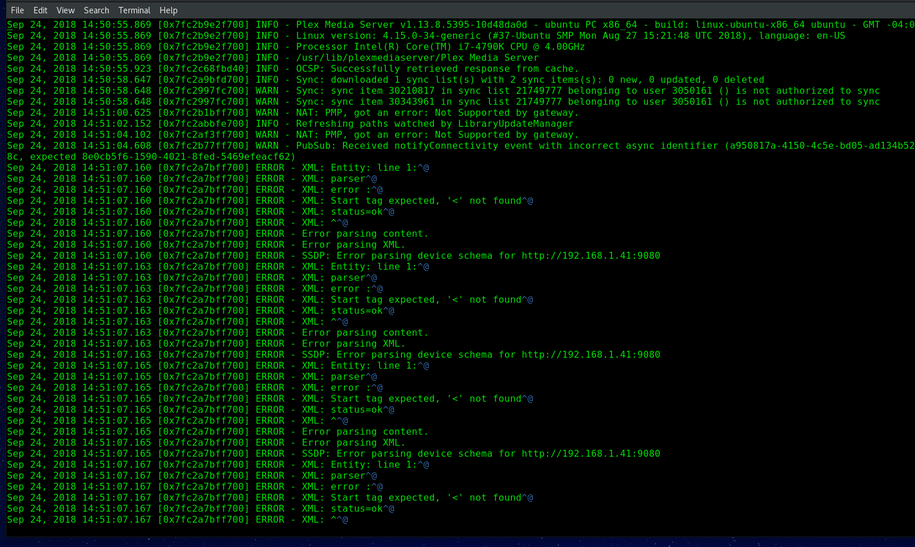
  1. disable Verbose logging
  2. these are not really errors. Plex server is looking for SSDP compatible devices on the network (either routers/gateways or Plex clients). It does so by requesting this description.xml file from each device it sees. If the device doesn’t understand the request or denies to answer (most likely because it isn’t a Plex client or a router) it’ll produce one such line in the log. There are no further consequences from this. You can ignore those messages.

I get what you’re saying, but there are a couple problems I have with just leaving it be.

  1. There is literally no client my my network with that IP address. I can’t ping it, it’s not registered as an in use IP address from my sophos UTM server. So what’s causing Plex to try and hit that specific IP?

  2. Plex is crashing a lot lately, something about issues with permissions or missing files in the transcode direcotry. Trying to debug that when I have to run through a thousand lines of spam from these errors/warnings is annoying as hell.

  1. Because one device exists in your network with that IP address, and it is discoverable by broadcast messages.

  2. understandable

May I have full DEBUG log files?

The log except above only shows errors and warnings. I need more

Plex Media Server Logs_2018-09-24_18-46-07.zip (634.7 KB)

ssdp discover.txt (22.2 KB)

Logs attached with debug enabled for a few minutes.

Also attached the output of 60 seconds of waiting on ssdp discovery replies.

How about this please? You might need to install nmap

sudo nmap -v -sn 192.168.1.0/24 

nmap.txt (16.4 KB)

Thank you. That’s nicely definitive.

Would you be kind enough to make certain your locale and character encoding are set?

I’m seeing a ‘code page’ which clearly isn’t Western ISO.

I’ll find a way to read this but do request for future reference.

This is originating within PMS.

Have you customized your configuration in any way with an Override?

That’s odd, nope, haven’t done any systemd overrides for plex on this server. I just went to the troubleshooting page and downloaded the log zip, and uploaded it here.

There is nothing I can debug here because DEBUG logging has been turned off.

Enabling DEBUG does not occupy more disk space. PMS only keeps the current 5.2 MB plus the 5 previous ones. All others roll off the end and are discarded.

Yea, like I said I just turned it on a bit ago. I can repost logs in an hour if that’ll help?

Yes please. A PMS restart will also help. We will be able to see everything PMS does when it starts.

Turned on debugging, restarted server, watched an episode.

Checked logs just before finishing my show and noticed no sign of that issue. But the second I stopped watching the show I checked again after a few minutes and noticed the entries in the log.

Plex Media Server Logs_2018-09-24_20-03-46.zip (1.0 MB)

The file you were watching has internal issues with its timestamps. Not a problem but the file itself isn’t in the best of shape

Sep 24, 2018 19:15:09.182 [0x7f15153ff700] DEBUG - Transcoder segment range: 0 - 2
Sep 24, 2018 19:15:09.186 [0x7f15123fe700] ERROR - [Transcoder] [mp4 @ 0x248c400] Application provided duration: -1 / timestamp: 883697 is out of range for mov/mp4 format
Sep 24, 2018 19:15:09.186 [0x7f1513bfe700] DEBUG - Transcoder segment range: 0 - 3
Sep 24, 2018 19:15:09.189 [0x7f1512bff700] DEBUG - Request: [192.168.1.50:51612 (Subnet)] GET /video/:/transcode/universal/dash/iwq2eeowejrry8j2tnyrpu21/1/1.m4s (18 live) TLS GZIP Signed-in
Sep 24, 2018 19:15:09.189 [0x7f1512bff700] DEBUG - Asked for segment 1 from session.
Sep 24, 2018 19:15:09.189 [0x7f1512bff700] DEBUG - Returning segment 1 from session: "/var/lib/plexmediaserver/Library/Application Support/Plex Media Server/Cache/Transcode/Sessions/plex-transcode-iwq2eeowejrry8j2tnyrpu21-7b5844b8-d446-4ed7-963a-250e7d3d92c5/chunk-stream1-00002.m4s"
Sep 24, 2018 19:15:09.189 [0x7f1512bff700] DEBUG - Content-Length of /var/lib/plexmediaserver/Library/Application Support/Plex Media Server/Cache/Transcode/Sessions/plex-transcode-iwq2eeowejrry8j2tnyrpu21-7b5844b8-d446-4ed7-963a-250e7d3d92c5/init-stream1.m4s,/var/lib/plexmediaserver/Library/Application Support/Plex Media Server/Cache/Transcode/Sessions/plex-transcode-iwq2eeowejrry8j2tnyrpu21-7b5844b8-d446-4ed7-963a-250e7d3d92c5/chunk-stream1-00002.m4s is 47971.
Sep 24, 2018 19:15:09.189 [0x7f152ffff700] DEBUG - Completed: [192.168.1.50:51612] 200 GET /video/:/transcode/universal/dash/iwq2eeowejrry8j2tnyrpu21/1/1.m4s (18 live) TLS GZIP 0ms 47971 bytes (pipelined: 12)
Sep 24, 2018 19:15:09.202 [0x7f1513bfe700] ERROR - [Transcoder] [mp4 @ 0x248c400] Application provided duration: -1 / timestamp: 1147900 is out of range for mov/mp4 format
Sep 24, 2018 19:15:09.202 [0x7f15153ff700] DEBUG - Transcoder segment range: 0 - 4
Sep 24, 2018 19:15:09.212 [0x7f15123fe700] ERROR - [Transcoder] [mp4 @ 0x248c400] Application provided duration: -1 / timestamp: 1325050 is out of range for mov/mp4 format

I see what’s happening and cannot explain it.

I have no idea where it’s coming from. Can you check with the person who was playing over the WAN and see if there is a 192.168.1.88 on that end?

He said he’s using 192.168.0. subnet, so not him. Any other debug ideas by chance?

I will ask engineering how they suggest to run a SSDP scan from a command line the way PMS does internally. Something is causing that address to be reported (perhaps the key). A device with two or more interfaces where only 1 is plugged-in ? Both will show.

Same problem. Only mine is a loopback address:

NetworkServiceBrowser: found 0 SSDP devices via http://169.254.200.234:8060/
Error issuing curl_easy_perform(handle): 28

Over and over and over…

+1, similar issue here. Mine isn’t a loopback address but it’s constantly attempting a SSDP GET (and failing) against an address that isn’t in my DHCP subnet.

Hi, same thing here. Plex is running on Windows Server 2012 R2 and everything works well. I am just wondering why this always shows up in the log file. The IP address is my second router (2nd internet outbreak). Does anybody know why plex tries to connect to the router? The gateway of the plex server is 192.168.0.1 which is correct. there is no additional routing entry for 192.168.0.138.

Here is what I found in the logfiles:

> Jan 04, 2019 20:43:53.138 [7940] WARN - HTTP error requesting GET http://192.168.0.138:37215/upnpdev.xml (0, No error) (Empty reply from server)> 
> Jan 04, 2019 20:54:53.173 [7940] WARN - HTTP error requesting GET http://192.168.0.138:37215/upnpdev.xml (0, No error) (Empty reply from server)> 
> Jan 04, 2019 20:54:53.178 [7940] WARN - HTTP error requesting GET http://192.168.0.138:37215/upnpdev.xml (0, No error) (Empty reply from server)> 
> Jan 04, 2019 20:54:53.183 [7940] WARN - HTTP error requesting GET http://192.168.0.138:37215/upnpdev.xml (0, No error) (Empty reply from server)

It shows up on a regular basis. ere is the detailed information:

> Jan 04, 2019 20:56:23.166 [7940] DEBUG - NetworkServiceBrowser: Parsing SSDP schema for http://192.168.0.138:37215/upnpdev.xml
> Jan 04, 2019 20:56:23.167 [7940] DEBUG - HTTP requesting GET http://192.168.0.138:37215/upnpdev.xml
> Jan 04, 2019 20:56:23.178 [7940] ERROR - Error issuing curl_easy_perform(handle): 52
> Jan 04, 2019 20:56:23.178 [7940] WARN - HTTP error requesting GET http://192.168.0.138:37215/upnpdev.xml (0, No error) (Empty reply from server)
> Jan 04, 2019 20:56:23.178 [7940] ERROR - SSDP: Error parsing device schema for http://192.168.0.138:37215/upnpdev.xml
> Jan 04, 2019 20:56:25.639 [7068] DEBUG - TrayIcon::WindowProc received DisplayIcon timer message
> Jan 04, 2019 20:56:25.639 [7068] WARN - Shell_NotifyIcon(NIM_ADD) failed: 0x0
> Jan 04, 2019 20:56:30.644 [7068] DEBUG - TrayIcon::WindowProc received DisplayIcon timer message
> Jan 04, 2019 20:56:30.644 [7068] WARN - Shell_NotifyIcon(NIM_ADD) failed: 0x0

Any clue? Thanks