Is this a normal looking bandwidth graph for one stream locally or is something wrong with it being so up and down? (The stream is not buffering.)

The reason that I ask is that something it looks like this (again not a problem playing for now).
Is this a normal looking bandwidth graph for one stream locally or is something wrong with it being so up and down? (The stream is not buffering.)
The reason that I ask is that something it looks like this (again not a problem playing for now).
Even if you notice no buffering, Plex will load the data for some seconds ahead of actually showing it. That’s not a linear process… so there’s no permanent data stream matching the file’s average bitrate. Instead, Plex will load a chunk of the video/audio data whenever its buffer runs below a certain threshold – hence the peaks.
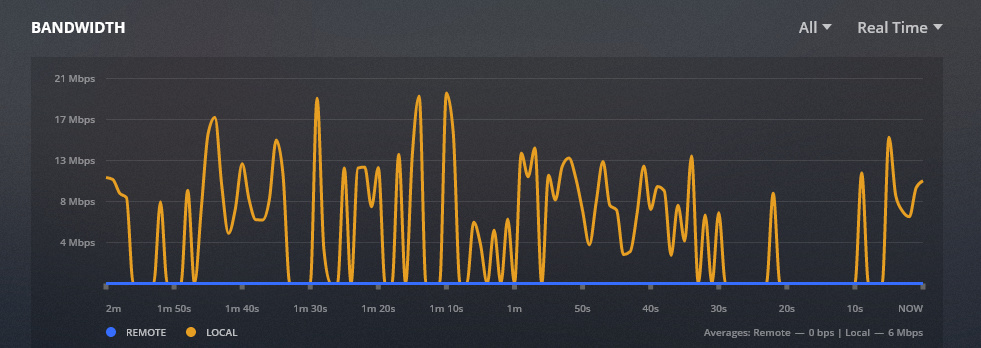
As for the comparison… it appears, you played 1 higher bitrate video in the 2nd graph. You see the average bitrate at the bottom right of each graph:
as for your key/main question:
yes, those are perfectly normal graphs 
This topic was automatically closed 90 days after the last reply. New replies are no longer allowed.