Plex Media Server: Ongoing Network Issue

S = Sleep (short) / System Call
D = Disk I/O wait

I don’t see a lot of D show up in top unless it’s really hammering on a physically slow drive.

If there is a lot of I/O , even buffered, the system call overhead will slow it down. Blocks are blocks, buffered or not.

heh 15 load average is very high.

how many cpu allocated to the plex vm?

http://www.brendangregg.com/blog/2017-08-08/linux-load-averages.html

edit:
load average is a relative moving indicator of how hard the system is working (not only cpu) over 3 periods of time.

also, fyi you can add the IO_RATE column to htop in the setup > columns and this will let you see per process io rates.

@ChuckPa - So the “D” in HTOP really means nothing to us then?

@TeknoJunky - I have 16 CPU’s allocated to the VM along with 8 GB’s of RAM reserved to that VM.

I have 2 ESXi hosts in cluster with VMotion turned on for all VM’s except my Plex box (unless there is a failure) and my domain controller (unless there is a failure).

Edit: Just to note, my load average is now at 4.48 4.75 4.60 and dropping so it does go up and down but 15 is the highest I see it.

The D means something. In a VM, that meaning changes. It means it’s asking the VM to go to the host which has to go to the physical disks and get the data. Twice the latency

But in my case as I’m not seeing any red D’s, I should keep an eye out but it’s not a problem at the moment…

Also to note, I just found a drive in my RAID that’s failing SMART. Replacement is going in momentarily there as well. I’m in a Raid-Z2 so one drive shouldn’t cause too much harm.

When you’re seeing a high load average in comparison to the number of CPUs… that is a problem

a load ave of 1.0, on a single core system means the CPU is maxed out.

A load ave of 15 on a 16 core system is you are at 15/16 (93% CPU) capacity.

In 1993, a Linux engineer found a nonintuitive case with load averages, and with a three-line patch changed them forever from “CPU load averages” to what one might call “system load averages.” His change included tasks in the uninterruptible state, so that load averages reflected demand for disk resources and not just CPUs. These system load averages count the number of threads working and waiting to work, and are summarized as a triplet of exponentially-damped moving sum averages that use 1, 5, and 15 minutes as constants in an equation. This triplet of numbers lets you see if load is increasing or decreasing, and their greatest value may be for relative comparisons with themselves.

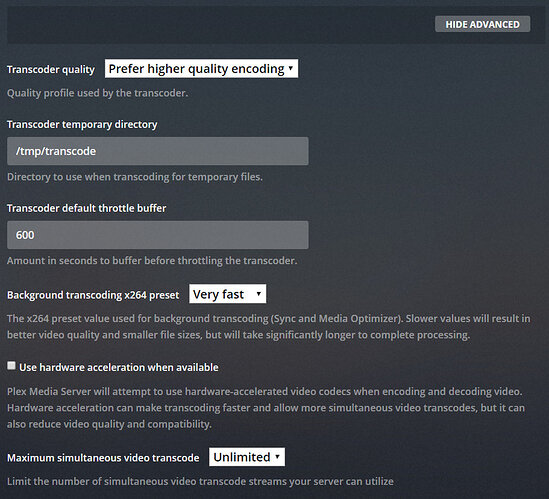
It’s transcoding 3 streams externally simultaneously right now. My transcode is set to 600 seconds (10 minutes). Here are my settings as they sit now:

The idea is that Plex transcodes ahead of where they are watching and less often then it normally would. I found this to remove buffering especially when we are talking about 5+ transcodes.

Does that make sense?

Quick Question regarding database speed…

I get the following errors after a fresh database rebuild (follow the script you provided above):

|Nov 17, 2018 17:08:20.187|ERROR|QueryParser: Invalid field 'onlyTransient' found, ignoring.|
|---|---|---|
|Nov 17, 2018 17:08:20.176|ERROR|QueryParser: Invalid field 'onlyTransient' found, ignoring.|
|Nov 17, 2018 17:08:20.111|ERROR|QueryParser: Invalid field 'onlyTransient' found, ignoring.|
|Nov 17, 2018 17:08:20.102|ERROR|QueryParser: Invalid field 'onlyTransient' found, ignoring.|
|Nov 17, 2018 17:08:19.865|WARN|SLOW QUERY: It took 220.000000 ms to retrieve 50 items.|
|Nov 17, 2018 17:08:19.407|WARN|SLOW QUERY: It took 240.000000 ms to retrieve 50 items.|

With the query speed issue, it’s definitely less time but should I be worried that it’s right out of the gate? What is the QueryParser error?

Thanks!

If you’re getting those errors, PMS will fail. It’s unavoidable.

How much media (items) do you have indexed?
What CPU resources are available?

Slow Query is what it means: The CPU could not complete the request to go to the DB, find the information needed, and return it within the 200ms time window allowed. When it did finally return, the trigger fired and it reported the time.

250 ms for 50 items is extreme. 10 ms for 500 is the norm.

Hey ChuckPA,

I have 32000 media files. Not sure how to confirm if all are indexed or not. CPU is 16 cores on a Dell Poweredge R710 with an Intel Xeon CPU E5620 @ 2.40 GHz.

Is there a way I can make the current setup not break? The scripts I have running to optimize are helping but I’d like to take any actions even if they are proactive to help make the current setup functional.

Thanks!

Erik,
I will need ask around. I don’t know of many installations that large.
Further, I don’t know why it’s corrupting / getting slow.

One option I would consider is to use a version which I know to be more stable. (1.13.4) if you have it.

Is there an archive I can download 1.13.4 from?

Also - I’m removing some data from the library. I’m down 2tb to 11tb but I’d like to keep as much up as possible.

Thanks!

I have a couple I use for regression testing.

Which Linux distro?

Ubuntu 18.04

Here’s from my G-drive.

Please ZIP the logs and keep safe for comparison. We will need them if a regression has occurred.

  1. stop pms
  2. uninstall (don’t purge)
  3. install
  4. Force refresh metadata for one library at a time. Wait until it completes before trying another

https://drive.google.com/open?id=1BZEy6YTGlP-9-GyM-jc1oXmOKFYqFeK7

So I did the steps, made it to step 3, installed and now plex won’t start. Trying to figure out why now.

status: exited, code: 255

Thinking it’s a permission thing? But all libraries and data are owned by plex:plex with permissions being 777 for /var/lib/plexmediaserver and /usr/lib/plexmediaserver and my Media Library.

manually (tar.gz) grab the logs. let’s see

Figured it out, the database was corrupted (when I setup a bash shell for plex and logged in as plex to run it, i got a bunch of table errors). I restored from a previous backup and am good now.

Also - I have removed 8300 bundles/media from my library. I’m looking at about a 25% media reduction and hopefully, someone has an idea on running these larger libraries! Otherwise, I’ll keep an eye on things and see if I have any more outages!

Edit: Another 800 bundles being removed now and counting (Plex is still scanning).

So I found a few more things that I thought I would raise:

  1. With my library size, would the following article be applicable: Work Around For Slow Movie Scanning for Extra Large Collections

I am having frequent issues with the library slowness queries but only after scanning. I did notice that it’s stopped occuring during playback so I’m wondering if it’s the fact that the libraries are so large slowing down the file system… I can break the individual folders down alphabetically and add each show to a subfolder to separate them out and add all the letters to the library? I want to make sure this is worth it before I engage that endeavor.

  1. I use a tool called “FreeFileSync” to backup my plex media (I have a separate backup system for my servers, VEEAM). This tool creates a file called “sync.ffs_lock” each time it scans (it was set to automatically scan every 30 minutes). As this was starting up, it was causing plex to repeatedly scan as it was detecting a “change” in the library. Using the method recommended by FreeFileSync to disable that (https://freefilesync.org/manual.php?topic=expert-settings), I am no longer frequently updating.

  2. Whenever my server optimizes, I get the following in my logs:

> |Nov 21, 2018 23:05:20.117|INFO|SQLITE3:0x10, 17, statement aborts at 57: [select * from metadata_items limit 1] database schema has changed|
> |---|---|---|
> |Nov 21, 2018 23:05:20.106|INFO|SQLITE3:0x10, 17, statement aborts at 57: [select * from metadata_items limit 1] database schema has changed|
> |Nov 21, 2018 23:05:20.096|INFO|SQLITE3:0x10, 17, statement aborts at 57: [select * from metadata_items limit 1] database schema has changed|
> |Nov 21, 2018 23:05:20.086|INFO|SQLITE3:0x10, 17, statement aborts at 57: [select * from metadata_items limit 1] database schema has changed|
> |Nov 21, 2018 23:05:20.075|INFO|SQLITE3:0x10, 17, statement aborts at 57: [select * from metadata_items limit 1] database schema has changed|
> |Nov 21, 2018 23:05:20.065|INFO|SQLITE3:0x10, 17, statement aborts at 57: [select * from metadata_items limit 1] database schema has changed|
> |Nov 21, 2018 23:05:20.055|INFO|SQLITE3:0x10, 17, statement aborts at 57: [select * from metadata_items limit 1] database schema has changed|
> |Nov 21, 2018 23:05:20.044|INFO|SQLITE3:0x10, 17, statement aborts at 57: [select * from metadata_items limit 1] database schema has changed|
> |Nov 21, 2018 23:05:20.034|INFO|SQLITE3:0x10, 17, statement aborts at 57: [select * from metadata_items limit 1] database schema has changed|
> |Nov 21, 2018 23:05:20.024|INFO|SQLITE3:0x10, 17, statement aborts at 57: [select * from metadata_items limit 1] database schema has changed|
> |Nov 21, 2018 23:05:20.014|INFO|SQLITE3:0x10, 17, statement aborts at 57: [select * from metadata_items limit 1] database schema has changed|
> |Nov 21, 2018 23:05:20.003|INFO|SQLITE3:0x10, 17, statement aborts at 57: [select * from metadata_items limit 1] database schema has changed|
> |Nov 21, 2018 23:05:19.993|INFO|SQLITE3:0x10, 17, statement aborts at 57: [select * from metadata_items limit 1] database schema has changed|
> |Nov 21, 2018 23:05:19.983|INFO|SQLITE3:0x10, 17, statement aborts at 57: [select * from metadata_items limit 1] database schema has changed|
> |Nov 21, 2018 23:05:19.943|INFO|SQLITE3:0x10, 17, statement aborts at 57: [select * from metadata_items limit 1] database schema has changed|
> |Nov 21, 2018 23:05:19.902|INFO|SQLITE3:0x10, 17, statement aborts at 57: [select * from metadata_items limit 1] database schema has changed|
> |Nov 21, 2018 23:05:19.862|INFO|SQLITE3:0x10, 17, statement aborts at 57: [select * from metadata_items limit 1] database schema has changed|
> |Nov 21, 2018 23:05:19.846|INFO|SQLITE3:0x10, 17, statement aborts at 57: [select * from metadata_items limit 1] database schema has changed|
> |Nov 21, 2018 23:05:19.835|INFO|SQLITE3:0x10, 17, statement aborts at 57: [select * from metadata_items limit 1] database schema has changed|

I have tried checking for corruption (came back OK) and repaired it anyways. I also tried rebuilding the DB and get this still. Is there something I can do to fix the database schema? Does it need to be fixed?

  1. I also get the following and I’m not sure what to make of it:
> |Nov 21, 2018 23:05:20.240|ERROR|Exception getting remote address: remote_endpoint: Transport endpoint is not connected|
> |---|---|---|
> |Nov 21, 2018 23:05:20.236|ERROR|Exception getting remote address: remote_endpoint: Transport endpoint is not connected|
> |Nov 21, 2018 23:05:20.232|ERROR|Exception getting remote address: remote_endpoint: Transport endpoint is not connected|
> |Nov 21, 2018 23:05:20.231|ERROR|Exception getting remote address: remote_endpoint: Transport endpoint is not connected|
> |Nov 21, 2018 23:05:20.173|ERROR|EventSource: Retrying in 15 seconds.|

Also to note, my load average in htop is down to 0.00 0.11 0.35 while all of the above is occurring.

Thanks!