Currently Running Linux version 1.16.2.1321 (upgrading tomorrow when I get some quiet time to 1.16.3.1402
For quite a while now I have been running a nightly cron to restart due to all the plex “features” and thought I would try not doing that since the memory leaks seem to be reported as being fixed now!
The uptime is 4.5 days (which is more than it did before with memory issues) but the plex process is still slowly rising and is now at :
PID USER PR NI VIRT RES SHR S %CPU %MEM TIME+ COMMAND
1675 plex 20 0 8904296 6.090g 15824 S 20.9 25.9 1569:43 Plex Media+
What is the normal memory usage for plex process? > 6GB Res seems high and is slowly rising…
No comments yet
Upgraded to 1.16.3.1402 this morning.
Memory at that point was under 1GB Res.
It as been slowly climbing during the day. at approx 12 hours in it stands at 2.9GB…
Will check in and update in the morning.
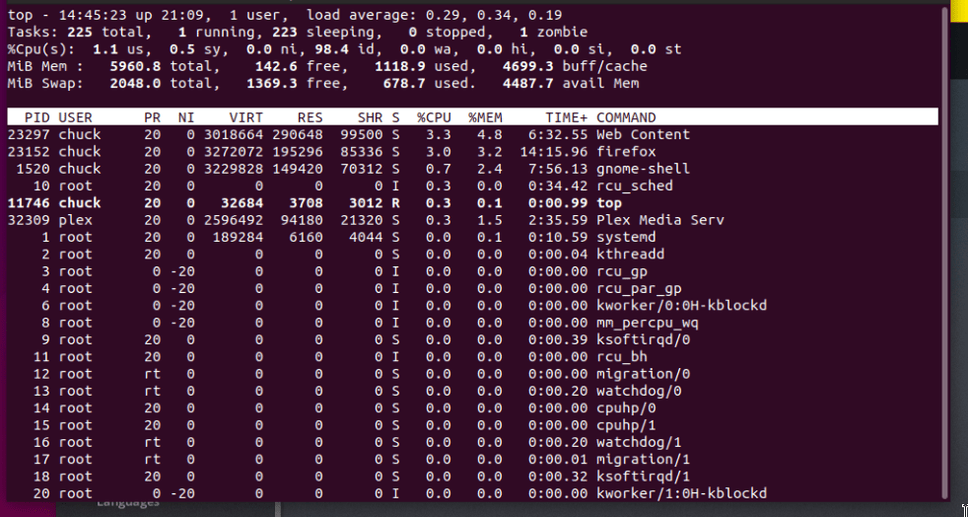
Which options are you looking at ? Are you looking at total VSZ (Virtual size) or WSS (working set size). Virtual Size will grow as PMS needs to expand the WSS during processing. Once processing is complete, it releases that memory back to the system and WSS decreases.
What you show above looks like 2.9GB VSZ with a working set size of 27756 pages (4K each) for a total of 111 MB of active RAM.
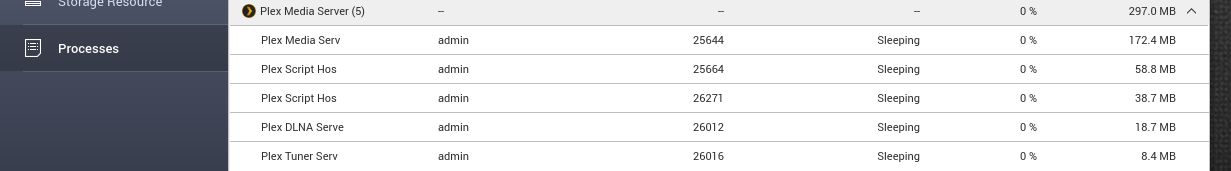
By comparison, on QNAP, with my server active. I use a bit more (297 MB)
The server is running Ubuntu 18.04.2 LTS
(Running as a VM under ESXi 6.7)
I assume you mean the July the 7th links from the post for the 1.16.2.1311 build?
Yes happy to give that a go. I will find a quiet point in the morning and install it and report back.
One point of note before I go for that version.
As well as happening on the version now : 1.16.3.1402 it was definately happening on 1.16.2.1321 prior to this.
I also have a couple of test servers (one a VM - On hyper-v, rather than ESXi and another on bare metal) and they also increase but at a MUCH slower rate.
The obvious thing that jumps out is the one that increases at a good pace gets a lot of use.
I have also discussed with some others and it seems the more use the faster the increase.
PS now up to 2.8GB
7714 plex 20 0 6723400 2.887g 25200 S 18.3 12.3 147:57.33 Plex Media Serv
Has your server that is sat there had any plays? Has it scanned any media? I guess there are many things that can cause it!
Thanks for looking. I guess the plays on my main server are pretty much a 50/50 mix of direct stream and transcodes of various quality settings.
Server is using quicksync - passthrough for the video transcodes.
Just for reference :
1 ) Server down-graded this morning - this one gets a lot of use. (VM under ESXi with quicksync passthrough) Plex uptime circa 13.5 hours
7714 plex 20 0 6723400 2.923g 22096 S 15.0 12.4 156:51.39 Plex Media Ser
2 ) VM under hyper-v Plex uptime a couple of weeks - only 1 play in last 2 weeks and some media scanning
1177 plex 20 0 2810828 754500 37224 S 0.0 18.8 1:33.27 Plex Media Serv
3 ) Bare metal Server (test) - Plex uptime > 2 weeks - virtually 0 plays - fair bit of media scanning
1027 plex 20 0 8831588 4.191g 3964 S 0.0 26.9 88:55.47 Plex Media Serv
This is my QNAP. It shows a nice cleanly traceable memory utilization. Notice VSZ and RSS are different. We have to be careful not to confuse the two. Resident is what will use memory.
So you are not seeing an increase, I can replicate on several machines and I know others can! (getting others to pile in with “me 2” comments will not help I assume?)
Will any logs help?
in the last 5 hours main server has gone from 3.8GB res to 4.7GB !
7714 plex 20 0 8254160 4.773g 19688 S 50.8 20.3 899:06.07 Plex Media Serv
I can allways go back to my daily cron jobs to restart the process but just trying to help in fixing what looks to be a clear bug!