I can’t speak to the other sections of the forum but I personally cover Linux, Synology, and QNAP. We have a number of new Ninjas just coming on board. ( I will finally be able to get some engineering work done but always am immediately reachable )
Poking around in QNAP settings I saw two virtual switches that existed from a prior installation of container station. I wondered if the new settings in 1.13.5 and the recent removal of container station is compounding the issue. So I decided to revert the preferences.xml back to pre-bonding settings and remove those two virtual switches. Restarting PMS didn’t seem to make a change. I rebooted the NAS hopefully to flush out any leftover settings and still nothing. Should I still look to edit the pref file to bond to some virtual interface?
And hey, thanks for all this help. Sincerely appreciated. Hopefully we can find resolution and I’ll recap what solved it so others will know when it happens to them.
But this is what is kind of confusing me. I was seeing it “last seen” in devices earlier when this wasn’t running and the estimated timestamp placed it like 1 or 2 AM which no changes should have happened since then to cause it to go down. It just acted like it sputtered and quit with the local network discovery (GDM).
I’ll keep monitoring it but hopefully, it doesn’t mysteriously disappear again. Sad to say I’m not sure what the exact issue was at this point.
Since it stopped working I
Updated to the latest PMS download from plex.tv
Updated all firmware/software on QNAP and rebooted
Updated the preferences.xml file to ServerBindInterface=“qvs0” but then reverted it when that didn’t solve the issue.
found some “leftover” container station virtual switches with different subnets from PMS that “might” have been causing issues and removed them. Rebooted again with no luck.
Checked once more after I went afk for a bit and #profit
I dunno…If it stays active for 24h I’ll try and remember to come back to this thread and confirm everything is working alright
Give Plex.tv time to sync up. Pubsub has caches and cache coherency to maintain.
QNAP does have issues with 4.3.4.0644 (we’ve chatted) and they’re on it.
In your current configuration (shown above) you don’t have a virtual switch in use so qvs0 will not apply. You’ll use the raw adapter name (ifconfig) shows that clearly from the shell when logged in over ssh.
In event this helps you or someone;
Looking at mine:
The bond is on the adapters themselves first
Container 1 (Docker) exists on its network
The four ethernet adapters are now listed (no idea why that order but Ok)
Loopback
Container 2 (LXC) exists on its network
The Virtual Switch governs it all.
The order I defined this in was:
Eth0
Bond
Vswitch
Docker
LXC
6-18 VMs for development (not listed in ifconfig)
yeah I don’t think the actual network overview ever used Virtual Switches…I just found a couple saying they related to container station in the Virtual Switch setup…they may have been inactive since I removed container station
This is the version I updated to so perhaps that was the issue and perhaps that’s why things are intermittently failing.
Just throwing my name in to this one too, running PMS 1.13.5.5291 on Synology DS416+ and the server is intermittently unavailable - Regardless of whether I am trying through app.plex.tv or accessing it via IP address directly. While accessible I’ve set the network interface in Settings > Network to the appropriate network interface on the NAS (in my case a bonded network listed as bond0) but it is still intermittently unavailable. Interestingly I updated to 1.13.5.5291 but I only started seeing this issue from around 24 hours ago, not sure if that’s relevant at all. Potentially relevant, I updated one of my clients (Windows 10) to the latest Plex Media Player which seems to have been released in the last couple of days, I’ll try downgrading it to the previous version to see if that helps. Here are my logs. Logs.zip (3.0 MB)
Sadly I’m going to have to unmark this as solved. Again PMS is offline and I can’t see the server anywhere despite the package service is running as well as the web service on port 32400, Can logon to PMS server interface via http://10.0.0.5:32400 but says server unavailable. I’ve done nothing but add about 200 movies to my library since we last spoke.
Are you using the advanced feature “Adapter to Listen on” (bind) ?
If so, which one please?
I do see the error being seen by others.
expected )
Aug 11, 2018 11:56:35.809 [0x7f501d3ff700] DEBUG - EventSource: Failure in IdleTimeout (0 - Success).
Aug 11, 2018 11:56:35.810 [0x7f501d3ff700] DEBUG - MyPlex: We appear to have lost Internet connectivity, resetting device URL cache.
Aug 11, 2018 11:56:35.810 [0x7f501d3ff700] DEBUG - MyPlex: We appear to have lost Internet connectivity, resetting device URL cache.
Aug 11, 2018 11:56:35.810 [0x7f501d3ff700] ERROR - EventSource: Retrying in 15 seconds.
Aug 11, 2018 11:56:35.810 [0x7f50113ff700] ERROR - [PlexRelay] kex protocol error: type 7 seq 11
Aug 11, 2018 11:56:35.810 [0x7f501d3ff700] DEBUG - WebSocket: client initiated close
Aug 11, 2018 11:56:35.810 [0x7f501d3ff700] DEBUG - CERT: incomplete TLS handshake: short read
Aug 11, 2018 11:56:35.811 [0x7f5014447700] INFO - [PlexRelay] Allocated port 29051 for remote forward to localhost:32401
Aug 11, 2018 11:56:35.812 [0x7f501d3ff700] DEBUG - handleStreamRead code 2: End of file
Aug 11, 2018 11:56:35.812 [0x7f501d3ff700] DEBUG - NotificationStream: Removing because of error
Aug 11, 2018 11:56:35.812 [0x7f501d3ff700] DEBUG - CERT: incomplete TLS handshake: short read
Aug 11, 2018 11:56:35.812 [0x7f501d3ff700] DEBUG - Completed after connection close: [192.168.1.7:59774] 200 PUT /myplex/refreshReachability (15 live) TLS GZIP 142349ms 31 bytes (pipelined: 5)
Today, I might have captured the root cause. We’re investigating now
Restarted 2-3 times and it came back up. Now froze in the middle of my kids watching a movie while I was adding more to the library. CPU utilization never rose higher than about 20%
It was converting audio for the chrildren’s streaming. That can take up to 1 full CPU.
What isn’t logged is Index Image generation and those can take up a LARGE portion of the CPU in spikes you might not see because of how Synology displays it.
Database queries look good (10 ms to retrieve 150 items)
I am seeing the poster / photo generation tasks streaming along as well as the scanner running.
Personally, I don’t push that CPU (C2538) to do anything while loading media.
Functionally, I see no errors in your logs whatsoever. It is all 10)% clean.
Could something in the docker container have kicked up and consumed CPU? I would not be able to see that here.
Docker is only running a single Ubiquiti AP controller. Unlikely. It’s not necessary to keep up at the moment, I can shut it down for a while and see if this stops.
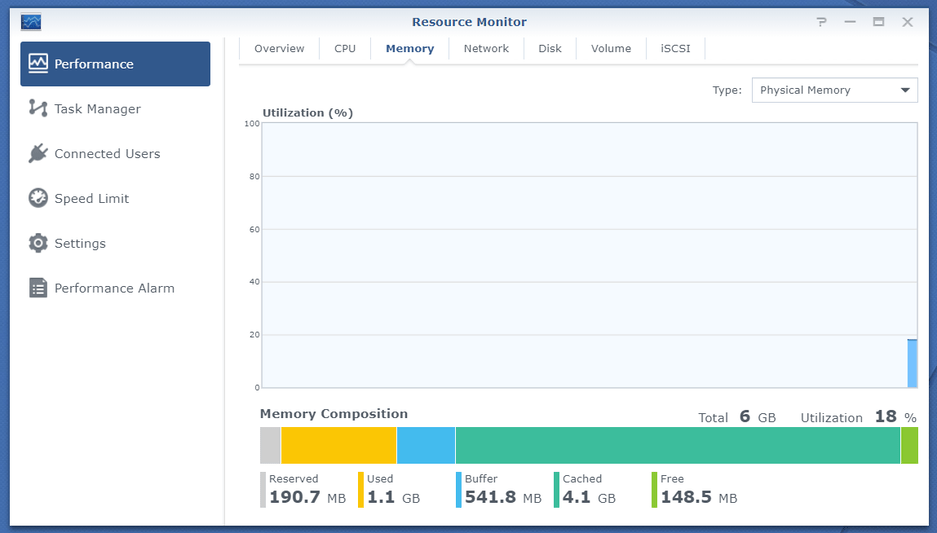
Thanks. Not knowing how much memory it takes compared to how much you have ??
It shouldn’t take much but I’ve seen systems with Docker running, plus PMS, all in 2GB of RAM. That’s painful.
Hope this is still on topic. Running Plex Server on DS 416Play. Upgraded to server ver PlexMediaServer-1.13.5.5291-6fa5e50a8-x86_64 about 6 days ago. Everything seemed fine at first. Then lots of soft crashes. Synology OS reports Plex server is running but the Plex server is totally unresponsive. Restarted Plex Server package 4-6 times in the last 5 days. Have also restarted Synology 2 or 3 times. This is very flaky and unstable on my system. My Synology usually goes 90+ days with no issues. Under the previous version of Plex Server (PlexMediaServer-1.13.2.5154-fd05be322-x86_64) I had to restart once in 40-50 days. I am downgrading to version PlexMediaServer-1.13.2.5154-fd05be322-x86_64 in hopes that I will get some stability. Having Plex dead almost every evening is not a great experience.

 )
)