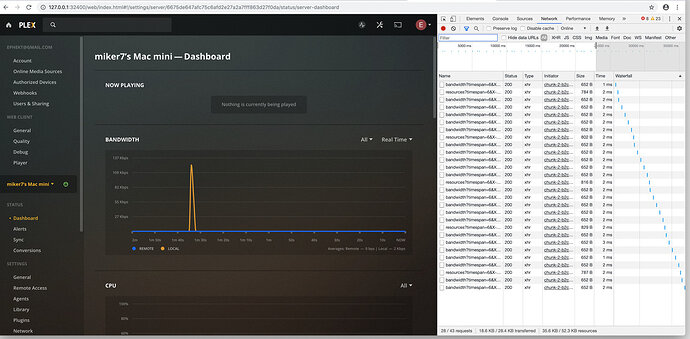
Hi All, I recently became a life-time member and upgraded to a new Mac Mini on my PMS from and Mac Mini. The new server is 3.2ghz/6-core/16gb-ram/16tb of SSDs. I run the PMS latest version. MacOS Mojave. The Plex Web app, on average, uses around 150mb of ram which isn’t a big deal (though pretty high for a chrome tab).
Unfortunately, in the latest Chrome, if I open the Plex tab and there is any activity, that activity/analytics page causes the CPU to spike past 5-10% and the page to freeze. Over time, it can calm down and I can navigate away from it.
I did some research through developer console and it appears that the biggest culprit is that the default Activity bandwidth monitor is set to real-time which fires off every (!!!) 2ms a query. Turning that to last 12 hours significantly drops this page from being a bully to just a peaceful pig.
- Have others experienced anything like this?
- Should I switch web browsers?
- Can I turn off Activity?
I’m tempted to ask for a refund over this feature.
p.s. I found another article, now closed, about ram spikes at Massive RAM Usage in Activity Dashboard - #54 by BlayZin but it was not so much an issue for me with ram.


