Dashboard not showing the bandwidth in real time

Server Version#: 1.19.3.2793
Running in a QNAP NAS TS-453 Pro (x86_64) FW: 4.4.2.1270
Player Version#: Plex Web Version 4.33.1

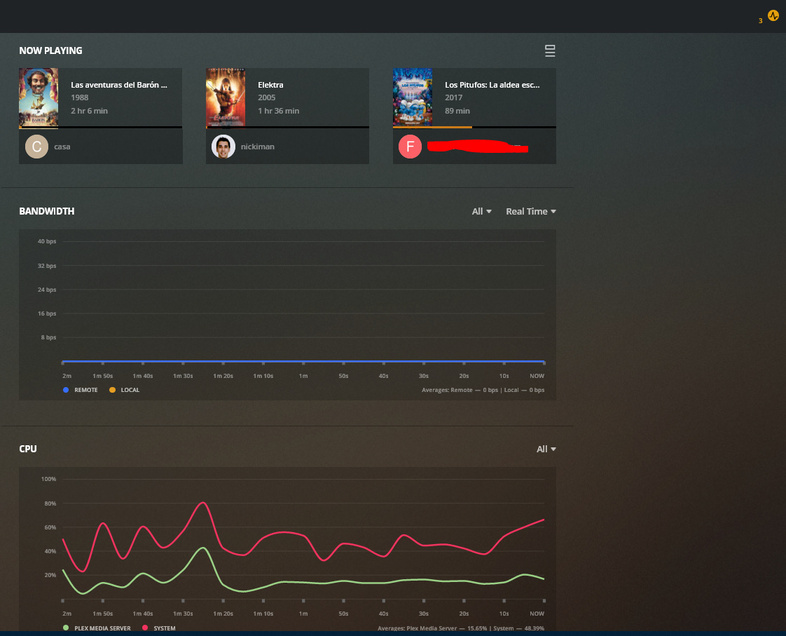
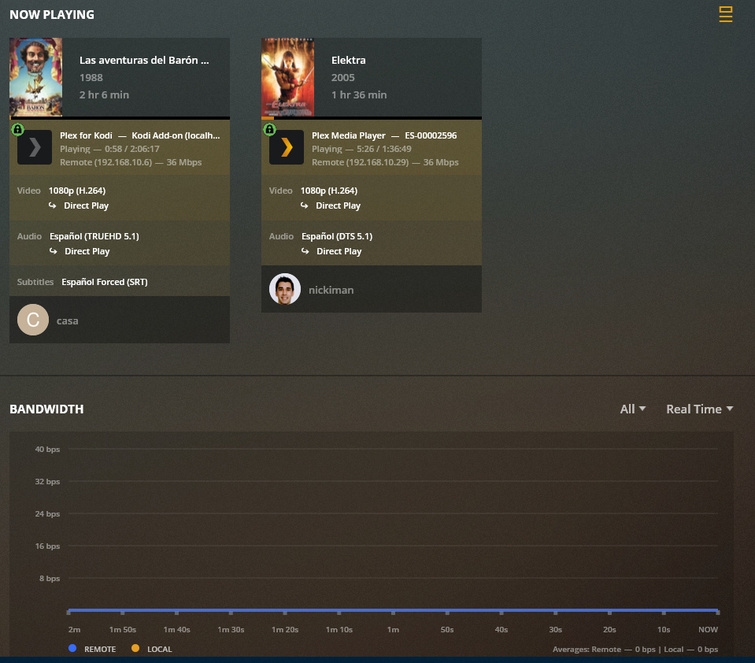
I´m having problems to check the bandwidth in real time of my server. CPU it´s correctly showed but bandwidth it´s only showed in different views with the exception of the real time mode.

No matter if the connection it´s done remotely or locally.

  1. I´ve tried to restart the app (apart of the update made recently) and restart the NAS without success.

  2. I´ve checked out that I have the same behaviour if I use the plex.tv connection or my local IP address from my LAN network.

  3. This issue has been checked out in FireFox and Microsoft Edge browsers.

Making some tests… I´ve tried to change the preferred network settings also:

From qvs0 adapter to Any but without no success.

There is also an issue… having all my apps with manual servers configured in my home´s network the bandwith that I can see in Plex Dash app are all as remote bandwidth.

Keep waiting your comments.

Thanks and best regards.

The display runs this way because the server is listening in promiscuous mode.
For better or worse, it’s reporting entire adapter traffic.

I’m not sure I understand. This was working not too long ago on my server as well, but now it’s flat when I know I have 4-8 people streaming off the server at time of checking. When I change from RealTime to last 12-24 hours or longer, it is showing the total bandwidth used. Something changed in a previous update that broke this functionality. I can confirm that I have also tried the same steps to fix that the original poster stated.

If RealTime charts are only showing the server running in “promiscuous mode” then what’s the point in having that option if its not really working the way it used too?

Where is the server running from; the main bonded ethernet adapter or one of the containers (which look like Container Station addresses) ?

Just to ask the questions:

  1. What is the V-switch set as as?
  2. qvs0 for the default gateway?

I have it connected to the main ethernet adapter.
I should note that if I look at Plex Dash, the real-time network activity is working and showing both local and remote connectivity. It’s only on the PlexWeb that it isn’t working.

Not sure to understand… but if you see the picture in my post should have traffic from the 3 streams running in that time more if it´s included the traffic of the entire adpater.

Well, PMS is running as an app more in QTS from APP Center. The configuration of the switch is this:

Not sure qvs0 is the default gateway… Having an ifconfig in my NAS… I think so:

I have the same question… I thought this graph only measure the quantity of bandwidth of the streams running.

In my case checking Plex Dash I see that all traffic measured is considered as remote always.

And my devices has configured manual servers to reach Plex from my LAN address.

Very weird

Plex Dash vs Plex/Web?

Show me please and label?

Look, right now I have running two streams in my home.

The devices has Manual servers configured to point to 192.168.10.12:32400 address/port which runs PMS at my home:

And this is what Plex Dash shows:

Thank you. Now, I understand.

I have the iOS app.

ah… OK. I´m running it in my Android phone. I don´t have any iOS device to check it out.

So, summarizing I have two issues in my Plex Media Server.

  1. I don´t see the bandwidth in real time from several releases ago…

  2. And also, from some releases ago I´m seeing that I can´t measure which traffic is used as local and which traffic is remote. Look the statistics:

Maybe this information can be useful to track in which release started this failure…

Those are player problems

The server did change the type and detail level of data it’s sending but as for existing in Android but not Plex/web — that is entirely Plex/Web and why I’ve placed this thread here for the Web team to view.

If there is a communication issue between server and player, it befalls them as it works for other players.

Really…? I´m having this issue will all my devices / players:

Plex Web
Plex for Android
Plex for Android TV
Plex (running in Windows 10)
Plex (Kodi 18 Add-On)

All of them configured to point to my internal IP address and showing the bandwidth (now in Plex Dash) as remote traffic bandwith.

Please understand –

I’m just the support guy. Yes, I do a lot but not everything.

Other than Plex/web on Linux, I haven’t touched any of what you listed above.

For that reason, I need to, and will, get someone to look at this.

@nickiman Check the computer times…

@nydave69

Thanks. Good catch. I missed that

Sorry, I didn’t want to sound rude or angry.
I really appreciate your support.

What do you mean regarding time? I´ve taked a look and NAS has time has 3 minutes early.
Is that the reason of the problem?

Thanks and best regards.

Could be… I don’t know your setup… most likely…
Just set the times correctly on your devices and lets see, in most cases it is fairly easy.

Well, at least I can see “some” peaks in the graph but, I think, not representing the real bandwidth used:

You can see at the picture the time of my computer and in the ssh session you can find also the date and time of the server.

And, as you can see the graph doesn´t show any relevant traffic in local just “something” in remote…

Keep in touch!