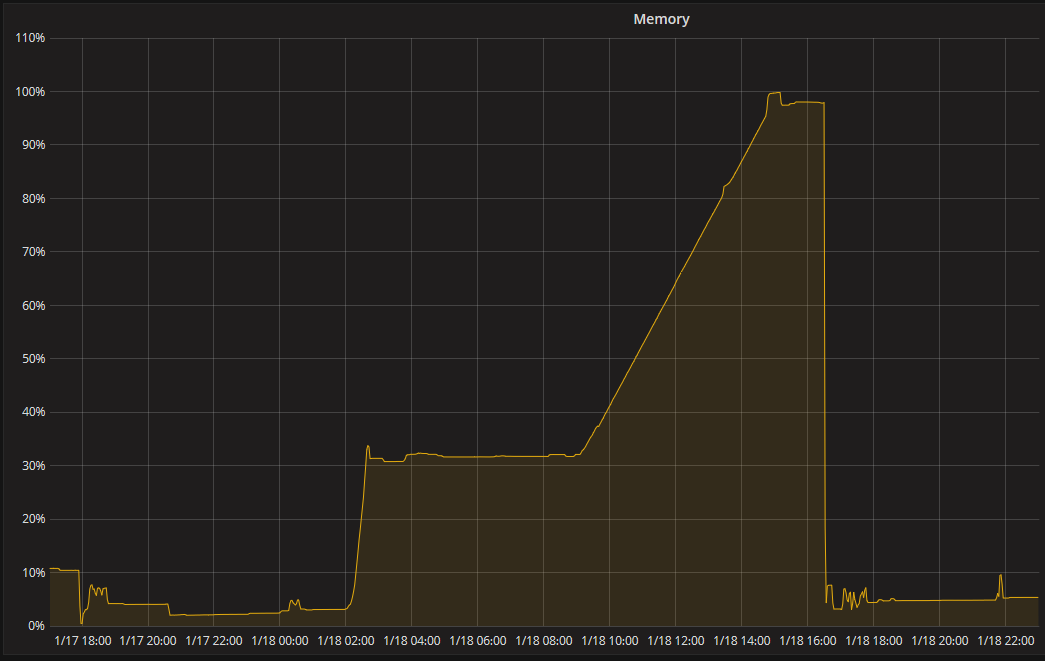
Every few days I’ll have to restart PMS after finding it has consumed nearly all the system memory. Currently the “Plex Media Server” process is using 95% of system ram (19.5 GB.)
The web dashboard incorrectly reports that it’s only using <5% of system ram.
This has the effect of making some clients very unresponsive. The web library will sometimes fail to load. The iOS app will actually crash around 30 seconds after opening.
Nothing in the logs jump out to me, but I’m not sure where to start looking.
Relevent section of ‘top’ if helpful:
Tasks:  34 total,   1 running,  33 sleeping,   0 stopped,   0 zombie
%Cpu(s):  0.1 us,  0.0 sy,  0.0 ni, 99.9 id,  0.0 wa,  0.0 hi,  0.0 si,  0.0 st
KiB Mem : 20480000 total,   483020 free, 19955044 used,    41936 buff/cache
KiB Swap:  8388604 total,  8138860 free,   249744 used.   524956 avail Mem

  PID USER      PR  NI    VIRT    RES    SHR S  %CPU %MEM     TIME+ COMMAND
 3096 plex      20   0 23.018g 0.018t  27644 S   0.5 95.3 338:27.74 Plex Media Serv
 3086 plex      20   0    4628    232    232 S   0.0  0.0   0:00.00 sh
 3122 plex      35  15 1788472  77168   7184 S   0.0  0.4   1:10.78 Plex Script Hos
 3174 plex      20   0  438028   5460   5368 S   0.0  0.0   0:01.85 Plex Tuner Serv
 3208 plex      20   0  953068  12560   4820 S   0.0  0.1   0:21.54 Plex Script Hos
 3210 plex      20   0  956192  12176   4864 S   0.0  0.1   0:20.51 Plex Script Hos
 3212 plex      20   0 1600296 196812   7800 S   0.0  1.0   6:12.53 Plex Script Hos
 5267 plex      20   0   17932   2972   2188 S   0.0  0.0   4:56.27 EasyAudioEncode
These logs unfortunately cover a small window due to playback activity.
Starting:
Jan 18, 2020 14:39:35.478 [0x7f2933d3c700] INFO - Plex Media Server v1.18.4.2171-ac2afe5f8 - Ubuntu PC x86_64 - build: linux-x86_64 debian - GMT 00:00
Jan 18, 2020 14:39:35.478 [0x7f2933d3c700] INFO - Linux version: 18.04.3 LTS (Bionic Beaver), language: C
Jan 18, 2020 14:39:35.478 [0x7f2933d3c700] INFO - Processor       Intel(R) Xeon(R) CPU E5-2680 v2 @ 2.80GHz
Jan 18, 2020 14:39:35.478 [0x7f2933d3c700] INFO - /usr/lib/plexmediaserver/Plex Media Server
Jan 18, 2020 14:39:35.477 [0x7f28357fa700] DEBUG - Audio Stream: 229195, Subtitle Stream: -1
Ending;
Jan 18, 2020 15:18:44.780 [0x7f284e7fc700] DEBUG - Request: [192.168.2.29:56560 (Allowed Network (Subnet))] GET /statistics/resources?timespan=6 (22 live) TLS GZIP Signed-in Token (tomkiley)
Jan 18, 2020 15:18:44.782 [0x7f292a60b700] DEBUG - Completed: [192.168.2.29:56560] 200 GET /statistics/resources?timespan=6 (22 live) TLS GZIP 1ms 968 bytes (pipelined: 11)
Jan 18, 2020 15:18:46.873 [0x7f292ae0c700] DEBUG - Auth: authenticated user 1 as tomkiley
Jan 18, 2020 15:18:46.873 [0x7f28b6ffd700] DEBUG - Request: [192.168.2.29:56535 (Allowed Network (Subnet))] GET /statistics/bandwidth?timespan=6 (22 live) TLS GZIP Signed-in Token (tomkiley)
Jan 18, 2020 15:18:46.883 [0x7f292ae0c700] DEBUG - Completed: [192.168.2.29:56535] 200 GET /statistics/bandwidth?timespan=6 (22 live) TLS GZIP 10ms 2749 bytes (pipelined: 151)
Tom,
I will provide a PM channel to you so I may see unedited logs if you’re willing.
What I saw looked like the LAN IP was 111.x.x.x. I have seen such things done in the past where folks think LAN IP can be anything they want because they are unaware of the RFC-1918 requirement and how basic IP routing works.
Might it be possible to see: a) a full set of logs inclusive of the agent and other logs b) all of which are unedited?