Server Version#: 1.19.5.3112-b23ab3896
Player Version#: various
I just upgraded my server’s video card to an Nvidia card with the Turing NVDEC and NVENC for transcoding. My previous card couldn’t do any HEVC/x.265 and most of my library is HEVC, but when there are a few clients that can’t direct stream in original quality, the transcoding hurts my CPU.
All is installed now and I am trying to figure out if NVDEC at least is being used. I have three streams being transcoding simultaneously now, they all say the are being decoded/encoded via hardware(hw), but it’s happeneing with all three streams. If I am not mistaken NVDEC/NVENC is limited to two sessions without the hack, so I am trying to figure out which streams are using NVDEC and which is using the CPU. Anyway to find out?
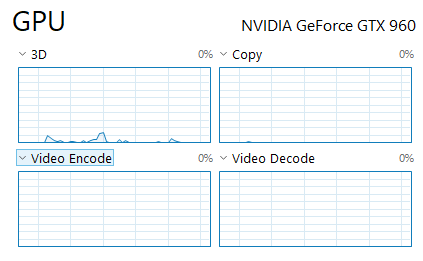
FYI my CPU is only running at 8-12% during these three streams, so something good is happening, but I would like to confirm.
Ok I went ahead and disabled my Nvidia card and the stream halted. When I restarted neither decode nor the encode were (hw), so it makes sense NVDEC/NVENC were doing all the transcoding. The GTX 760 could only decode and encode x264, so this is a nice upgrade. All is fine now. The CPU use was a dead giveaway anyway, just wanted to be sure.
What isn’t explained is how I was able to fully hw transcode three simultaneous sessions with my new card. I thought Nvidia had limited that to two sessions in the driver. My Intel graphics is disabled in the bios.
For post playback analysis, look in the Plex log files. Set your system for debug logs (verbose has too much info). Then pull the logs and look for the same line. Search in Plex Media Server.log (wraps to .1, .2, … .5.log).
In addition to TPU:, search for MDE: (Media Decision Engine). Along with the timestamps you can figure out the info on a per-stream basis.
See “Reporting Issues…” support document for info on configuring & pulling log files.