Server Version#: Version 1.15.1.710
Player Version#: Version 3.89.2
Server Linux Ubuntu 16.04
Switched from Gracenote since it would “always” crash trying to load EPG to xmltv. EPG will load manually but crashes when it tries to load the EPG on its own.
Note: I’ve been looking at the logs. The latest crash occurs at about 13:49. The server became unresponsive and I had to stop the VM that it is operating in. After restarting the VM, I regenerated the guide data by rerunning the script (usually it runs everyday as called by a cron entry). I then did a manual EPG refresh which worked perfectly. I haven’t had any issues running the manual updates, but PMS has crashed at times running updates on its own.
Crashed again today, same symptoms. It looks like the initialization of the EPG creates a spike in memory use which is more than the system can handle. I read somewhere in the forums that the memory spike is more pronounced when there are more than 100 stations listed in the EPG. I’ve cut my listings down to 90 (from 110), we’ll see what happens.
Is it possible to set the time when PMS updates the EPG? I’d like to set it around 3 AM, just after the zap2xml script has updated the listings. There’s no need for any updates any other time.
Crashed again today at roughly the same time (1 PM to 2 PM). Note the spike in disk I/O just before the crash as the VM runs out of memory and tries to do virtual memory. Not sure what the spike in network traffic is about. PMS is the only thing running on this VM, an identical VM that is also running just PMS but is on Version 1.14.1.5488 but hosting my HDHomeRun Dual with just 17 stations never gets above 5 GB of memory used, this VM (HDHomeRun PRIME with 90 stations) uses up all of the 8 GB I’ve given it and that isn’t enough. The drop in memory used at about 2:05 PM is when I had to kill and restart the VM. Note the much lower memory use after the restart when I manually refreshed the EPG.
OK, so I just updated the server to Version 1.15.1.791. The good news is a drop off in memory usage (updated installed at about 3:24 PM) and a successful EPG refresh on its own.
Thanks for all the detail. Are you able to reproduce the spike in memory use ? Would like to see when it happens together with debug logs from the server for the time.
The logs show three Guide incremental updates that started at
03:37 am, 07:37 am and 11:37 am. The memory spike you mention I presume was after 11:37 am ?
Do you know how high memory usage was then? You mention it was a spike - do these spikes come down to normality?
i am investigating a memory leak issue in another topic and forum user @millerim provided me with a minute by minute memory usage snapshots for the Plex Media Server process - are you in a position to do the same ? That, together with zipped logs captured a few times a day should help pin down the activity that is using up the extra memory and if this memory gets released or not.
The snapshots were written to text file, eg this extract
|Date/Time| Memory |
3/22/19 10:41:24
5,975,796
3/22/19 10:42:24
5,975,796
3/22/19 10:43:24
5,975,796
3/22/19 10:44:24
5,975,796
3/22/19 10:45:25
6,434,548
I need to establish if your issue is the same or specific to XMLTV Guide refresh
What i need to see is if there is what looks like a memory leak after every guide refresh
If you do manage to run a script that captures memory usage snapshots for the process - please run it to do that every minute and to record the time (including seconds) and memory used and periodically - twice a day perhaps - capture the logs. Starting of course with a fresh launch of the server
OK, I’ve created and am running the script as listed by @millerim. However, I’m not sure if that will help since the problem I’m having is when PMS exceeds available memory and goes to virtual memory (paging/swap). I can hear when this happens by the rapid sound of the disk being accessed. The system becomes unresponsive (all current recordings fail) and I have to restart the VM in which PMS is running. Snapshot of the last event.
Ok so we use the minute by minute memory snapshot that was written to file from the time the server was started until the time it crashed out and together with the zipped logs that can be downloaded after restarting the server together with any earlier downloaded zipped logs (i mentioned few times a day) to investigate the problem
Some new behavior, the recorder is stopping mid recording. This appears to be happening at the same time as an EPG refresh initiated by PMS (a manual refresh doesn’t kill a running recording). My memory capture log is only partial but shows the most recent (3:43 PM) event.
Sun Mar 24 15:39:54 EDT 2019
7599544
Sun Mar 24 15:40:54 EDT 2019
7599544
Sun Mar 24 15:41:54 EDT 2019
7599544
Sun Mar 24 15:42:54 EDT 2019
7599544
Sun Mar 24 15:43:54 EDT 2019
8193288
Sun Mar 24 15:46:33 EDT 2019
9221552
I increased the memory in this VM to 10 GB, it still doesn’t seem to be enough. Note that I have another VM with PMS running which I have set to record from my HDHomeRun Dual. It has been completely stable without any of the issues here (using HDHomeRun Prime).
Finally, a quick question, is there any way to set a single time for PMS to refresh the EPG? Since I’m only updating the grab file once a day, there’s no need to run updates more than once.
But i need better evidence so that i can definitely say if it is the same or another bug or more than one bug
The logs show two EPG refreshes - these incremental updates happen every 4 hours. The two were started at 11:43:43 am and 15:43:43 pm
The increase in memory usage from 7,599,544 at 15:42:54 to 8,193,288 at 15:43:54 we can guess it being related to the 15:43:43 EPG update = but I would like to know what happened to the memory usage between 11:42 am and 11:48 am
The chart for memory use you attached does cover period from 15:39:54 onwards but the memory snapshots show memory at 7,599,544 at that time - and the chart seems to show it at or close to 10Gb throughout - is that chart giving actual memory used ?
What would be the reason for the gap in memory snapshot times between 15:43:54 and 15:46:33 ?
Lets make the snapshots at 30 seconds and please write to a file and start from a new launch of Plex Media Server. There may be additional memory usage issue for XMLTV and the extra snapshots may help pin this down
OK, rebooted the VM yesterday. The attached mem.log was started after that. So far PMS has been stable, completing a few recording jobs.
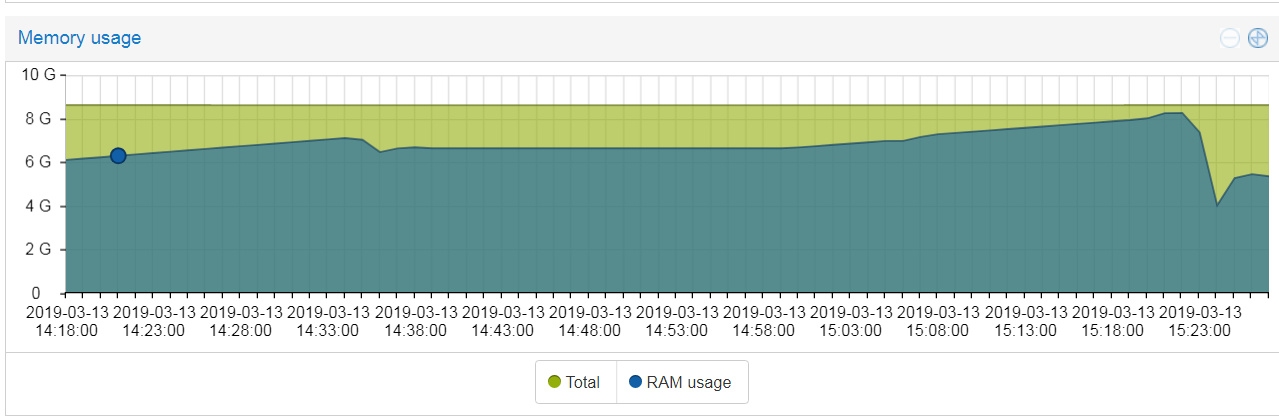
The memory chart shows memory for the entire VM as shown by my VM manager. Since PMS is the only thing running on this VM, the difference may be due to the underlying operating system (Ubuntu 16.04).
Here is a more recent chart, note the steady increase in memory usage since the reboot yesterday afternoon.
So 4 hours after the last reboot of the VM (when presumably the EPG is refreshed), two recordings were killed. While the mem-log shows about 4 GB, it does not appear to include all of the memory PMS is using as shown by this HTOP screen: