My Plex setup has been working great for many years now. I’m using Linux/Unraid/Docker and I mostly use the Apple TV client. As of about a week ago, I’m experiencing the following problems:
My server will sometimes become unavailable for periods of around 30-60 seconds. I’ve confirmed this both on local and remote connections.
My local streams will sometimes hit a black screen and need to buffer. More rarely, they will quit the stream with some error message about the playback session (will get exact text of this next time it happens)
The most bizarre thing is, as of when this started happening, if I leave a local stream paused, it will magically unpause itself after a small period of time (it’s random but usually under 2 minutes). I’ve observed this on the Apple TV client with local streams. I’ve tried to reproduce it on Plex Web but it doesn’t seem to happen there.
And to add to the frustration, none of my remote users are seeing any of these problems.
I’ve done the following to try to figure out what’s going on:
Rolled back PMS to a version before the problem, no change
The Apple TV client hasn’t been updated in months, so it’s not that
I use Moonlight to stream between that same Apple TV and my server, and that still works perfectly fine, so I doubt it’s a problem with my local network configuration
Tried repairing my DB using ChuckPA, no change
I’ll try to grab some server logs next time it happens, but nothing has really jumped out at me from them so far other than I’m getting a lot of “Transaction held too long” warnings. These are happening pretty regularly and some of them report stalls longer than 30 seconds, so this is my main suspect right now. However, the DB is on NVMe, no idea how it could be this slow. I’m also not sure whether these slow transaction logs were happening before the problems or not.
I’ll update with more info as I can get it, but hoping somebody has at least a theory as to what could possibly be doing all of this (especially the phantom unpausing).
Here’s an example of what my server warning/error logs look like right now, nothing is even playing. I have a cron job hitting the status endpoint every minute which should be the only traffic here.
When ChuckPA was running I think it said the two databases were around 300MB and 700MB, though I’m not sure if that makes sense given I have about 60TB of media in there. I’ll read through this thread and see if any of it applies, thanks for the suggestion!
Seeing the problem with direct streams with no transcoding happening, so unlikely this is related. It’s also happening way more often than any of my library scans. But thanks for the suggestion
Took a peek into the DB size thread and it seems like a very promising lead, it’s specifically calling out statistics which is also showing up a lot in my slow transaction logs. Will try to check that out tonight.
Tried turning off automatic library scans, still seeing slow transaction logs but it just made it 20 minutes without buffering, will report back if that actually fixes it (which would be bonkers).
Whatever’s going on has gotten worse and my server is now going hard down until I restart it (so remote users are also affected now). Automatic library scans disabled didn’t fix it.
Putting a Datadog synthetic on my server has revealed that whatever’s happening slowly increases the server’s overall response time (this is the status endpoint) until eventually it falls over and needs to be rebooted. This really looks like some sort of resource leak on the PMS side.
Actually, I think I might know what this is! I have a cron job that occasionally hits the server’s status and library endpoints. The drop in the graph here corresponds to when I turned that cron job off to see if it helped something. So it seems very likely there’s something in either the status or library endpoints that is leaking something or accumulating lag as it runs.
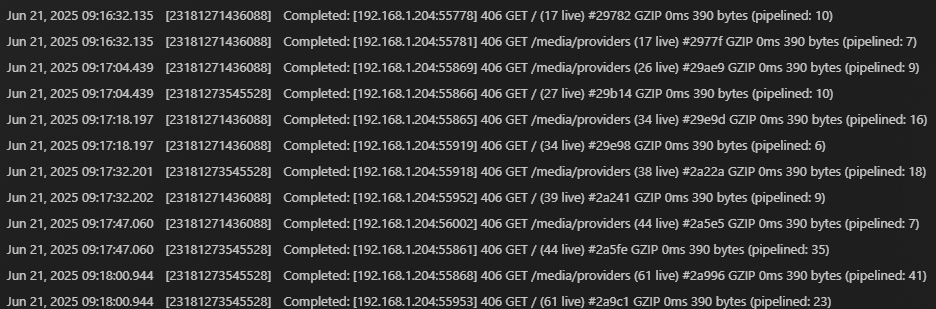
I’m continuing to narrow this down. The server hangs seem to happen when this Python lib, PlexAPI, hits the / (server capabilities) endpoint as part of initializing its connection. I haven’t been able to replicate this with just cURL yet, but here are some logs from a request that took down my server for almost 2 minutes:
The library is giving a new random value to X-Plex-Client-Identifier on every request fresh connection, which has happened every minute for the last five years because I run a cron job against the status endpoint. The server hits the period of degradation only sometimes, and only when it’s a client identifier it hasn’t seen before. This was why I couldn’t reproduce with cURL, because I was replaying previous requests and not generating new identifiers. Once I told PlexAPI to always use the same identifier, the problem seems to have gone away.
So this is clearly a problem on the server side, but that’s closed source, so I’m not sure how to proceed. Is there a way to flag this to the server team? I suspect that blasting a bunch of requests to / with varying X-Plex-Client-Identifier will reproduce the issue.
edit: I suspect this may also be causing the DB slowness, I probably have a few million unique client IDs stored up somewhere
Great investigating. I’ve been silently watching your post, but had no ideas to contribute. Unless you get a response from a dev, (like @BigWheel) (poke) acknowledging they are investigating the issue, assume that they are not aware of the issue.
I also truncated my statistics_bandwidth table (which had data from 2020 still in it) and my media_streams table (which had data from 2023). Not sure how much that helped, but with those tables cleared and the identifiers no longer randomized, I’m no longer seeing any of the long transaction time warnings from SQLite.