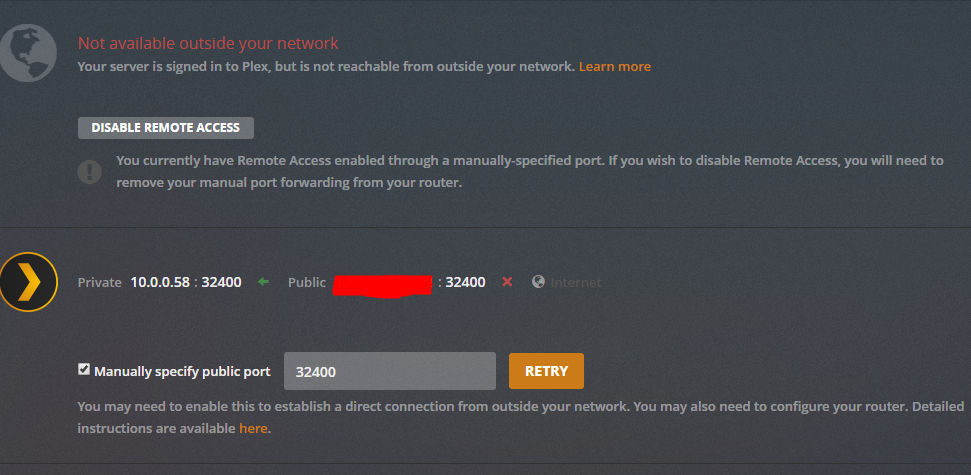
Was never enabled…
Also a debug log
[
  {
    "type": "info",
    "host": "app.plex.tv",
    "userAgent": "Mozilla/5.0 (Windows NT 10.0; Win64; x64) AppleWebKit/537.36 (KHTML, like Gecko) Chrome/74.0.3729.169 Safari/537.36",
    "browser": {
      "platformVersion": "10",
      "id": "chrome",
      "name": "Chrome",
      "version": "74.0",
      "webkit": true,
      "platform": "Windows",
      "platformID": "windows",
      "platformModifierKey": "ctrl"
    },
    "version": "3.100.1",
    "primaryServerUrl": "https://10-0-0-58.ee70f4dc6bf249dfbff7274612f54067.plex.direct:32400/",
    "primaryServerAuthToken": true,
    "username": "Wtfaatp",
    "cloudUrl": [
      {
        "scheme": "https",
        "address": "plex.tv",
        "uri": "https://plex.tv",
        "testState": "connected",
        "isBundled": false,
        "isFallback": false,
        "relay": false,
        "isUntested": false,
        "isPending": false,
        "isConnected": true,
        "isUnauthorized": false,
        "isUnavailable": false,
        "isFailed": false,
        "isAborted": false,
        "isLoopback": false,
        "isPrivate": false,
        "isHttps": true,
        "isSecure": true,
        "isPlexDirect": false,
        "currentTest": null,
        "sources": [
          {
            "id": "internal"
          }
        ]
      }
    ]
  },
  {
    "type": "navigation",
    "route": "logs",
    "args": [
      null
    ],
    "fragment": "#!/logs",
    "time": "2019-05-26T05:19:46.907Z"
  },
  {
    "type": "log:message",
    "level": 4,
    "message": "[Servers] Populate any server chose Temp-Server where servers = Temp-Server, plex.tv",
    "time": "2019-05-26T05:20:12.118Z"
  },
  {
    "type": "log:message",
    "level": 4,
    "message": "[Servers] Populate any server chose Temp-Server where servers = Temp-Server, plex.tv",
    "time": "2019-05-26T05:20:12.120Z"
  },
  {
    "type": "navigation",
    "route": "webSettings",
    "args": [
      "debug",
      null
    ],
    "fragment": "#!/settings/web/debug",
    "time": "2019-05-26T05:20:12.147Z"
  },
  {
    "type": "log:message",
    "level": 3,
    "message": "[Metrics] Updating session last interaction time",
    "time": "2019-05-26T05:20:12.162Z"
  },
  {
    "type": "ajax",
    "url": "https://analytics.plex.tv/collect/event",
    "status": 200,
    "params": "{\"deviceIdentifier\":\"1u4eab8as85h6bgqhvz44pjm\",\"context\":{\"device\":{\"product\":\"Plex Web\",\"version\":\"3.100.1\",\"platform\":\"Chrome\",\"platformVersion\":\"74.0\",\"device\":\"Windows\",\"model\":\"hosted\",\"screenResolution\":\"1366x667,1366x768\",\"layout\":\"desktop\"}},\"event\":\"client:view\",\"interaction\":true,\"properties\":{\"pane\":\"web:debug\",\"page\":\"settings\"},\"sessionIdentifier\":\"93f754ec-b097-4810-8d06-07296366386d\"}",
    "responseLength": 0,
    "time": "2019-05-26T05:20:12.295Z"
  },
  {
    "type": "navigation",
    "route": "logs",
    "args": [
      null
    ],
    "fragment": "#!/logs",
    "time": "2019-05-26T05:20:20.669Z"
  },
  {
    "type": "log:message",
    "level": 3,
    "message": "[Vote:4nlcciyvc0yagyg3glqohmbc] Upvote, someone else is leader",
    "time": "2019-05-26T05:20:26.489Z"
  }
]