Server Version#: 1.14.1.5488
macOS Version#: 10.13.6
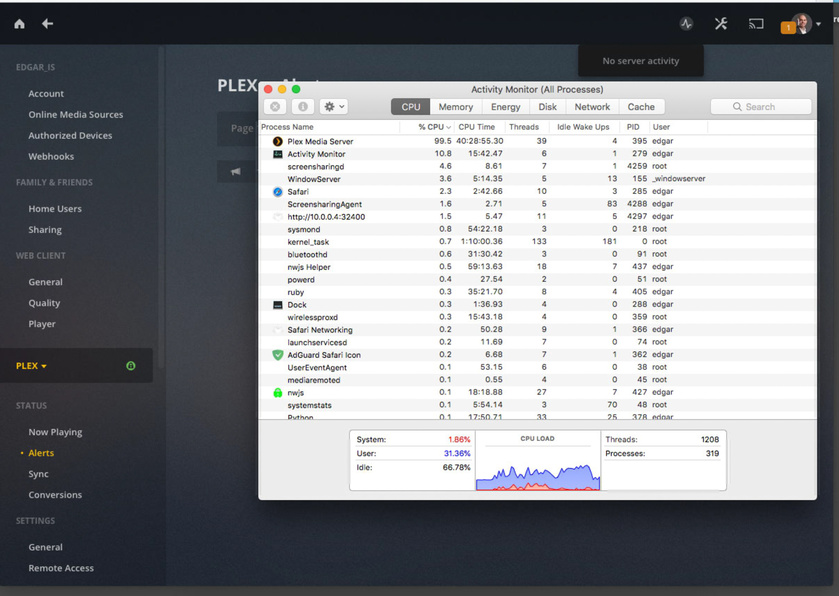
Any advice?
Anything going on in logs?
This is the same bug that’s been reported in several other thread already. The issue is with Plex version 1.14.1 – downgrading to 1.14.0 or earlier fixes it.
Running 1.14.1 and having no excessive CPU usage. Mojave 10.14.3 on a iMac late 2015. To me a logs report is required.
Plex Media Server Logs_2019-01-24_09-10-08.zip (2.6 MB)
I attached the logs I just exported. I’ll try going through them and making sense of what’s going on but I’m sure you know exactly where to look.
Have you got Generate Chapter and video thumbnails enabled?
Just wanted to add a “me too” here. I was seeing constant 100% utilisation of one core with a “plex media server” process on my linux/synology server as soon as I updated to 1.14.1.5488. It went away when I went back to 1.14.0.5470.
Plex doesn’t provide older versions themselves but they’re not too hard to find with a bit of Googling.
FWIW, I spent a long time poring over logs and examine ‘lsof’ output and couldn’t see anything obvious. A dev in another thread suggests it may be an interaction with the PMS server process and some system library.
I am looking at the logs. They cover from January 7th to January 24th. Does the cpu % usage remain at that level throughout or specific periods of time.
So the screenshots we have show it was at that level on Saturday 19th at about 10:48 am. You restarted the server at 10:54 - so did usage go down and climb again to 90% ? (Does the total for that mac come to 200% - 2 cores)
Would like to have a look at the database - could you download the database zip through the web interface and send me by private message - with fresh logs taken when cpu is high and indicating the time that activity monitor was refreshed for the screenshot
Yes, it’s throughout. I know this because the fan on the Mac mini is constantly going at full speed and be heard. When I shut down Plex at 10:54 the fans slowed down and I couldn’t hear them. As soon as I started it up they spun at full speed.
I’m PM’ing you another log file in case it helps as well as the DB export. I’m at work right now and I don’t currently have VNC access to the Mac mini remotely to take screenshots.
Thank you!
Thanks for the database and logs, Can’t see anything specific in the logs or database. The logs show that when it idle, it is purging a few bandwidth stats records every 30 seconds which would not explain the continuous cpu usage
what we could try
= enabling verbose logging to see if any clues there whilst it is apparently looping (the loop is obviously not solid as we can see in the log other activities do run)
Logs would be needed with process dump and any dtrace
Hi there, a few of us have made headway with the 5488 build on another thread and discovered that disabling UPnP on our routers and restarting PMS stops the high CPU utilisation. It’s a workaround, not a fix, as other devices in you network may need UPnP, but it’d be interesting to see if this makes any difference in your situation.
Yup, that made the high cpu utilization go away.
Fantastic news and thanks for the feedback.
What router are you using and is it the stock firmware or OpenWRT?
I’ve definitely seen this behaviour so far with the miniupnpd software on OpenWRT and it would be interesting to see if it’s apparent on any other hardware/firmware combos.
Please be aware that this should only be considered a workaround, not a fix, as other devices on your network may need UPnP or have degraded functionality without it, ymmv.
With stock firmware
Thanks, I’ll have a look and see if that model uses miniupnpd 
Well, sadly Amplifi aren’t very good at declaring what open source software they use to build their products with (unfortunately all-too-common a problem with commercials!) but some research suggests it’s based on OpenWRT (as many router firmwares are). It’s very likely to be running miniupnpd as a consequence.
Thanks again @edgar_is
Thanks for the feedback and getting to the cause
I will have a look at the other forum thread(s)
Would it be possible to get server logs with verbose logging enabled at the the time of the high cpu usage together with wireshark packet capture ?
The pcap can be sent to me zipped by private message
I will get this to you this evening