Strange activity bandwidth chart

Server Version#: 1.19.4.2935
Qnap TS-873

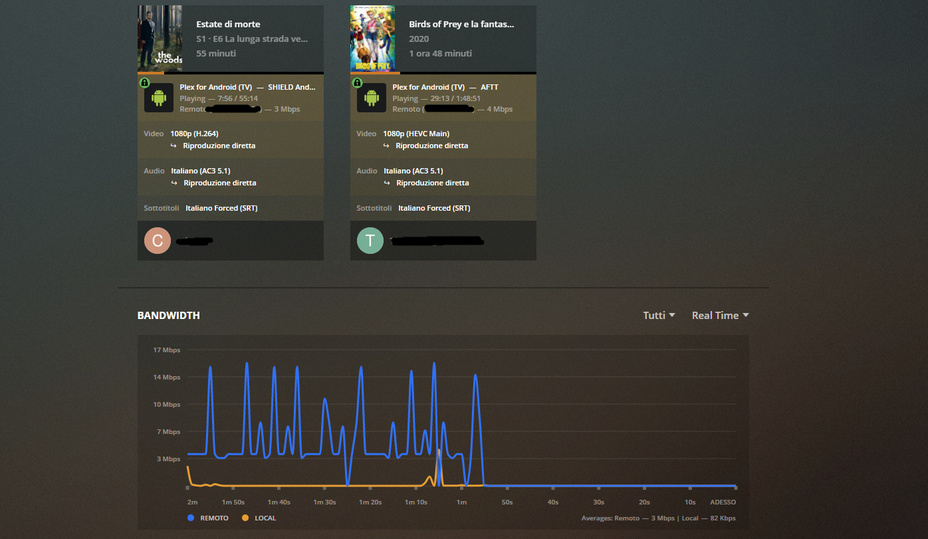
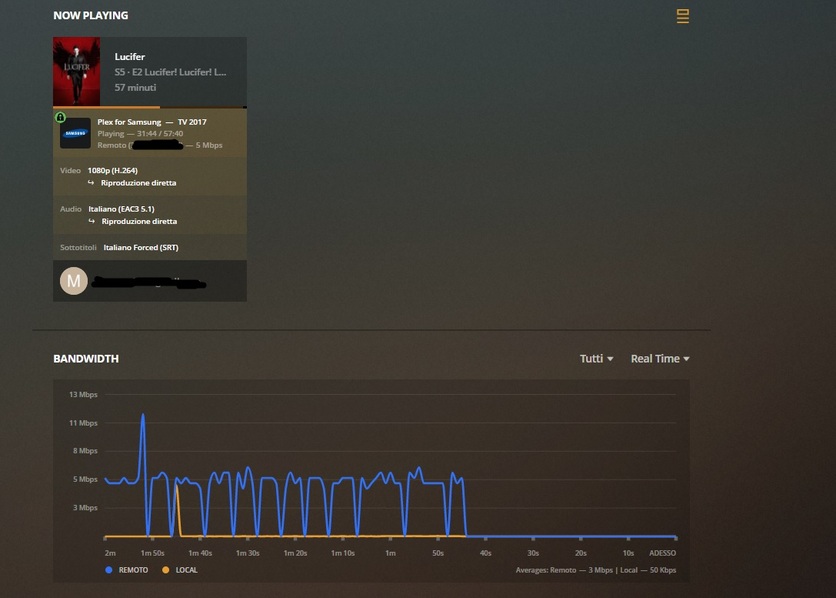
I have had this nas for a few days, everything works perfectly, but I noticed the bandwidth graph that has anomalies which I do not reveal on the plex shield server and windows server.

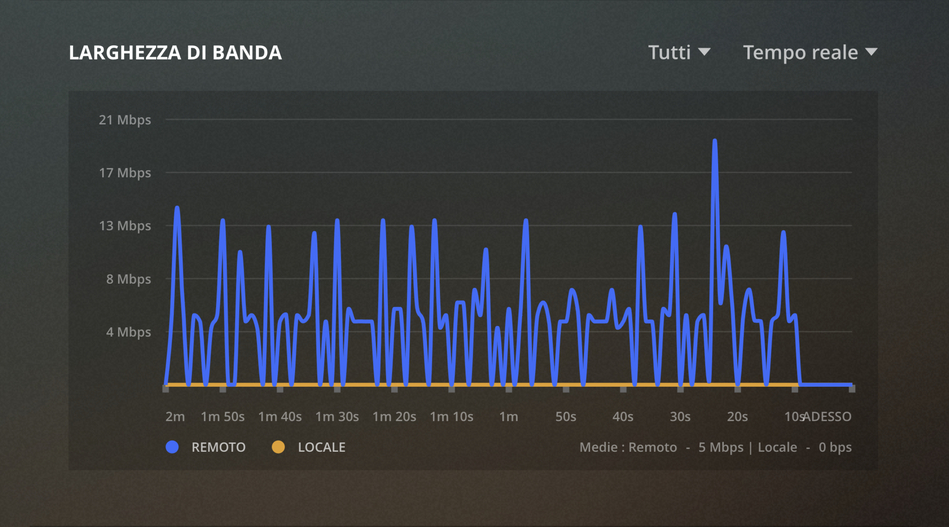
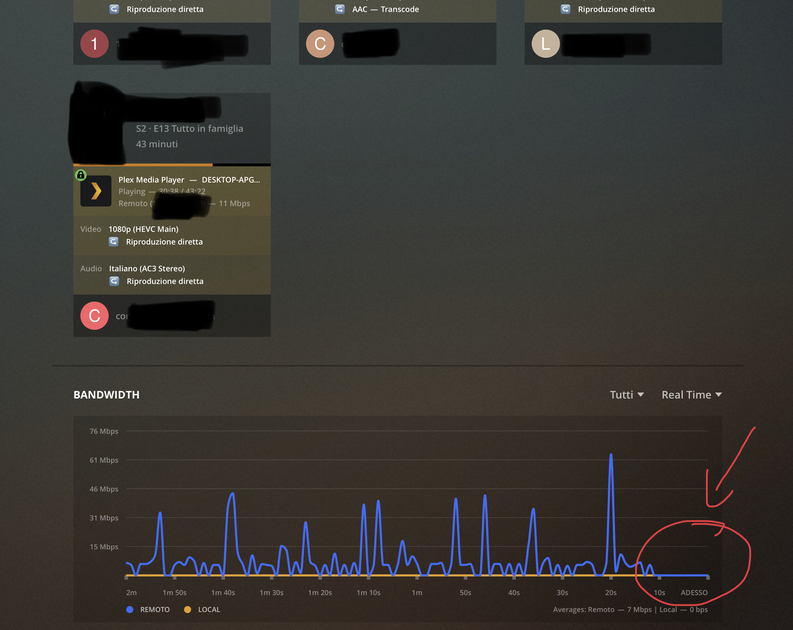
every day the graph starts starting always later, after 12 hours it starts from 2 seconds and after 24 hours it starts from 10seconds.

if I completely restart the nas the graph returns to normal.

I don’t know if I made myself understood.

I attach some photos for clarity.

the graph from the photos is after 18 hours of activity


Registrazione schermo 2020-06-16 alle 06.47.57.zip (12.7 MB)

operation after about 30 hours, as you can see the graph shifts more and more.

I just wanted to know if it’s a bug on the qnap plex servers or there is something wrong with my PMS.

thanks

this is after 6 days of activity.

does anyone find such a thing?

Try it with a different browser, ideally one without any plugins.

Tried with safari, chrome, firefox (windows, mac), always the same. If I restart the Nas, everything goes back to normal, then as the hours go by the graph delays more and more.

1 Like

the more days pass the more the graph is wrong in the results.

yeah I have to agree thats pretty weird.

my (non-qnap) server has never done that and its been up for months at a time

are you using the local ip or Plex Web ?

are you using a pms install from qnap, or from plex downloads ?

I have had a plex server on nvidia shield for about 3 years, never had a similar bug, not even the plex server on the old nas (wdMyCloud ex4100).

I am using Local IP, but it also does it on plexweb.
The installation was taken as the base on the qnap store, then manually updated to the latest version.

i think it’s a plex server problem and qnap qts.

Nothing, even with the qts and plex media server update v: 1.19.5.3035, the chart gets high hour after hour.
Nobody has ideas?

Unfortunately I still have this problem even after several Plex Server updates and qnap fw updates.

Is this an issue with clocks and time?

Does the clock and time on your client match the clock and time on the NAS?

If they are slightly out of sync, the chart will be slightly out of sync. If the clocks are significantly off, sometimes it won’t display at all!

It’s possible the NAS/Server synchronizes time at boot, and the time drifts more and more the longer it’s on.

1 Like

You are a genius!!! a genius!
I never thought about it.

I aimed the synchronization of my nas on a server every 24 hours … the graph immediately returned to go perfectly.

Thanks so much again.

2 Likes

This topic was automatically closed 90 days after the last reply. New replies are no longer allowed.