Unresponsive server & "slow query" logs

Server Version#: 1.15.8.1198
Player Version#: Plex for TiVo (though same behavior on all clients)

My server keeps going unresponsive and I have to restart the service.

The non-DEBUG level logs generally look like this right before it goes unresponsive:

Jun 13, 2019 19:27:36.129 [0x7f91f8ff9700] WARN - SLOW QUERY: It took 3400.000000 ms to retrieve 88 items.
Jun 13, 2019 19:28:06.849 [0x7f91c2ffd700] WARN - SLOW QUERY: It took 3350.000000 ms to retrieve 1 items.
Jun 13, 2019 19:28:37.577 [0x7f926d83f700] ERROR - EventSource: Retrying in 15 seconds.
Jun 13, 2019 19:28:37.579 [0x7f91c3fff700] ERROR - Caught exception trying to stream file: /dev/shm/plex/transcoder/Transcode/Sessions/plex-transcode-zq35e8ia0xu48efgvblc8fr7-ec9e2014-ce05-4385-9839-d3a65853ba24/media-01566.ts: write: protocol is shutdown
Jun 13, 2019 19:28:37.627 [0x7f92437fe700] WARN - Held transaction for too long (../Statistics/StatisticsManager.cpp:248): 0.160000 seconds

I have my database on a NFS mounted NAS and am wondering if having Plex Media Server on a non-local drive is causing the problems.

SLOW QUERY is the most likely root cause here.

The database has become extremely fragmented

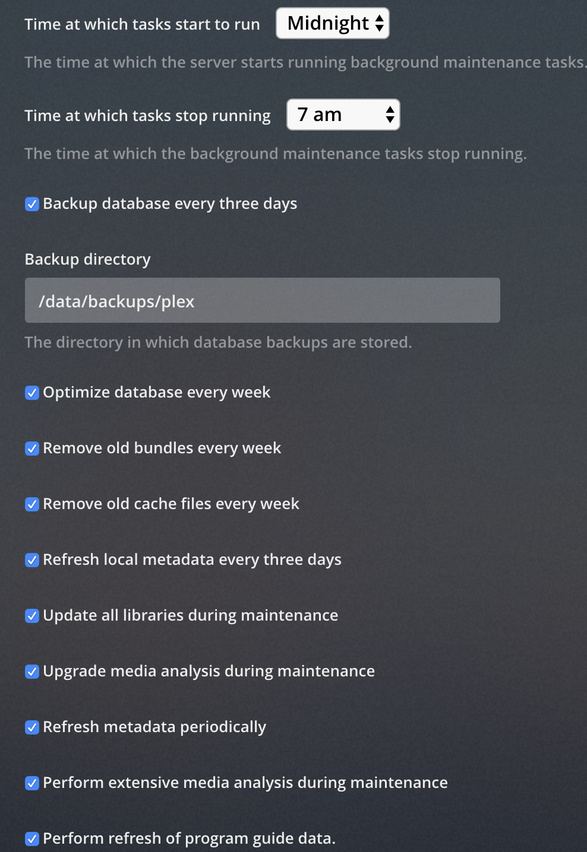
This is normally prevented when the butler makes its weekly optimization pass. It’s on by default.

Did you disable this and is plex running when the maintenance is scheduled?

To correct the problem as you see it now:

  1. Hover over Library (Left pane) to expose the ellipsis
  2. Click it
  3. Click “Optimize database”

While here, since your maintenance is most likely behind on many fronts,

  1. Empty Trash
  2. Clean Bundles
  3. Optimize Database one last time.

Now restart PMS

The “Event Source” can be one of two things:
a) The database
b) Networking.

If your issue is not solved, I will need the full set of logs to investigate further
(Settings - server - troubleshooting - download logs) Attach the ZIP

I’ll give that a try. I believe I have all of the scheduled maintenance enabled:

Is there something easy I can grep the logs for to verify DB optimization is running?

Edit: duh “grep -i optimiz” gives me:

Jun 13, 2019 00:01:04.029 [0x7f2237fff700] DEBUG - Activity: registered new activity f8bcc1e3-8c47-438e-a6ea-7ccd04ba5e68 - Optimizing database
Jun 13, 2019 00:01:04.029 [0x7f2237fff700] DEBUG - Database optimization: Optimizing database. Starting by capturing all sessions.
Jun 13, 2019 00:01:04.029 [0x7f2237fff700] DEBUG - Activity: updated activity f8bcc1e3-8c47-438e-a6ea-7ccd04ba5e68 - completed 0% - Optimizing database
Jun 13, 2019 00:01:04.029 [0x7f2237fff700] DEBUG - Activity: updated activity f8bcc1e3-8c47-438e-a6ea-7ccd04ba5e68 - completed 10% - Optimizing database
Jun 13, 2019 00:01:04.105 [0x7f2237fff700] DEBUG - Database optimization: Rebuilding full text search tables.
Jun 13, 2019 00:01:04.105 [0x7f2237fff700] DEBUG - Activity: updated activity f8bcc1e3-8c47-438e-a6ea-7ccd04ba5e68 - completed 40% - Optimizing database
Jun 13, 2019 00:01:07.094 [0x7f2237fff700] DEBUG - Database optimization: starting.
Jun 13, 2019 00:01:07.094 [0x7f2237fff700] DEBUG - Activity: updated activity f8bcc1e3-8c47-438e-a6ea-7ccd04ba5e68 - completed 60% - Optimizing database
Jun 13, 2019 00:01:10.102 [0x7f2237fff700] DEBUG - Database optimization: complete.
Jun 13, 2019 00:01:10.438 [0x7f2237fff700] DEBUG - Butler: optimized your database

What’s the host, memory, and all the techie details of the box?

I hope you’re not running out of gas or memory

It is an Ubuntu 18.04.2 LTS (GNU/Linux 4.15.0-51-generic x86_64) guest on a VMWare host. Host has 128GB and 2x 16 core Intel® Xeon® CPU E5-2670 0 @ 2.60GHz.

Guest has access to all 32 cores (shared) and 64GB of ram (dedicated). Host level CPU utilization peaks around 40%, no spikes when this happens

$ free -h
              total        used        free      shared  buff/cache   available
Mem:            62G        905M        9.8G        2.3G         52G         59G
Swap:          8.0G          0B        8.0G

$ top
top - 20:36:43 up 6 days, 54 min,  2 users,  load average: 0.00, 0.03, 0.07
Tasks: 414 total,   1 running, 217 sleeping,   0 stopped,   0 zombie
%Cpu(s):  0.0 us,  0.0 sy,  0.0 ni, 99.9 id,  0.0 wa,  0.0 hi,  0.0 si,  0.0 st
KiB Mem : 65965728 total, 10103280 free,   926256 used, 54936192 buff/cache
KiB Swap:  8385532 total,  8385532 free,        0 used. 61722228 avail Mem

My best guess right now is a NAS IOPS issue with having the database mounted on a NFS share.

Vmware host’s with how man VCPUs?

Also, I just realized (my apologies), You’re on 1.15.8.1198.

Do you have an older version you can install?

I ask this because 1.15.8.1198 is known for slowdown.

1 Like

Guest has 32 vCPUs assigned to it (access to all cores)

I have the following debs locally:

1.15.4.993-bb4a2cb6c_amd64.deb
1.15.4.994-107756f7e_amd64.deb
1.15.5.994-4610c6e8d_amd64.deb
1.15.6.1079-78232c603_amd64.deb
1.15.8.1163-005053bb5_amd64.deb
1.15.8.1198-eadbcbb45_amd64.deb

Is it easy to know which ones I can safely downgrade to?

1.15.4.994 is stable. I packaged that one for Synology. It’s a good build.
Start there

Great, and I can safely down-grade from my current build or do I need to do a backup restore as well?

remove . do not purge.
then install.

1 Like

Sounds good, I’ll do that tonight and report back in a few days if everything looks good.

Thank you for the quick help!

Any time! Glad I was nearby

1 Like

Downgrading appears to have resolved the issue.

This topic was automatically closed 90 days after the last reply. New replies are no longer allowed.